\n
## Stacked Horizontal Bar Chart: Loop vs. Successful Counts by Strength
### Overview
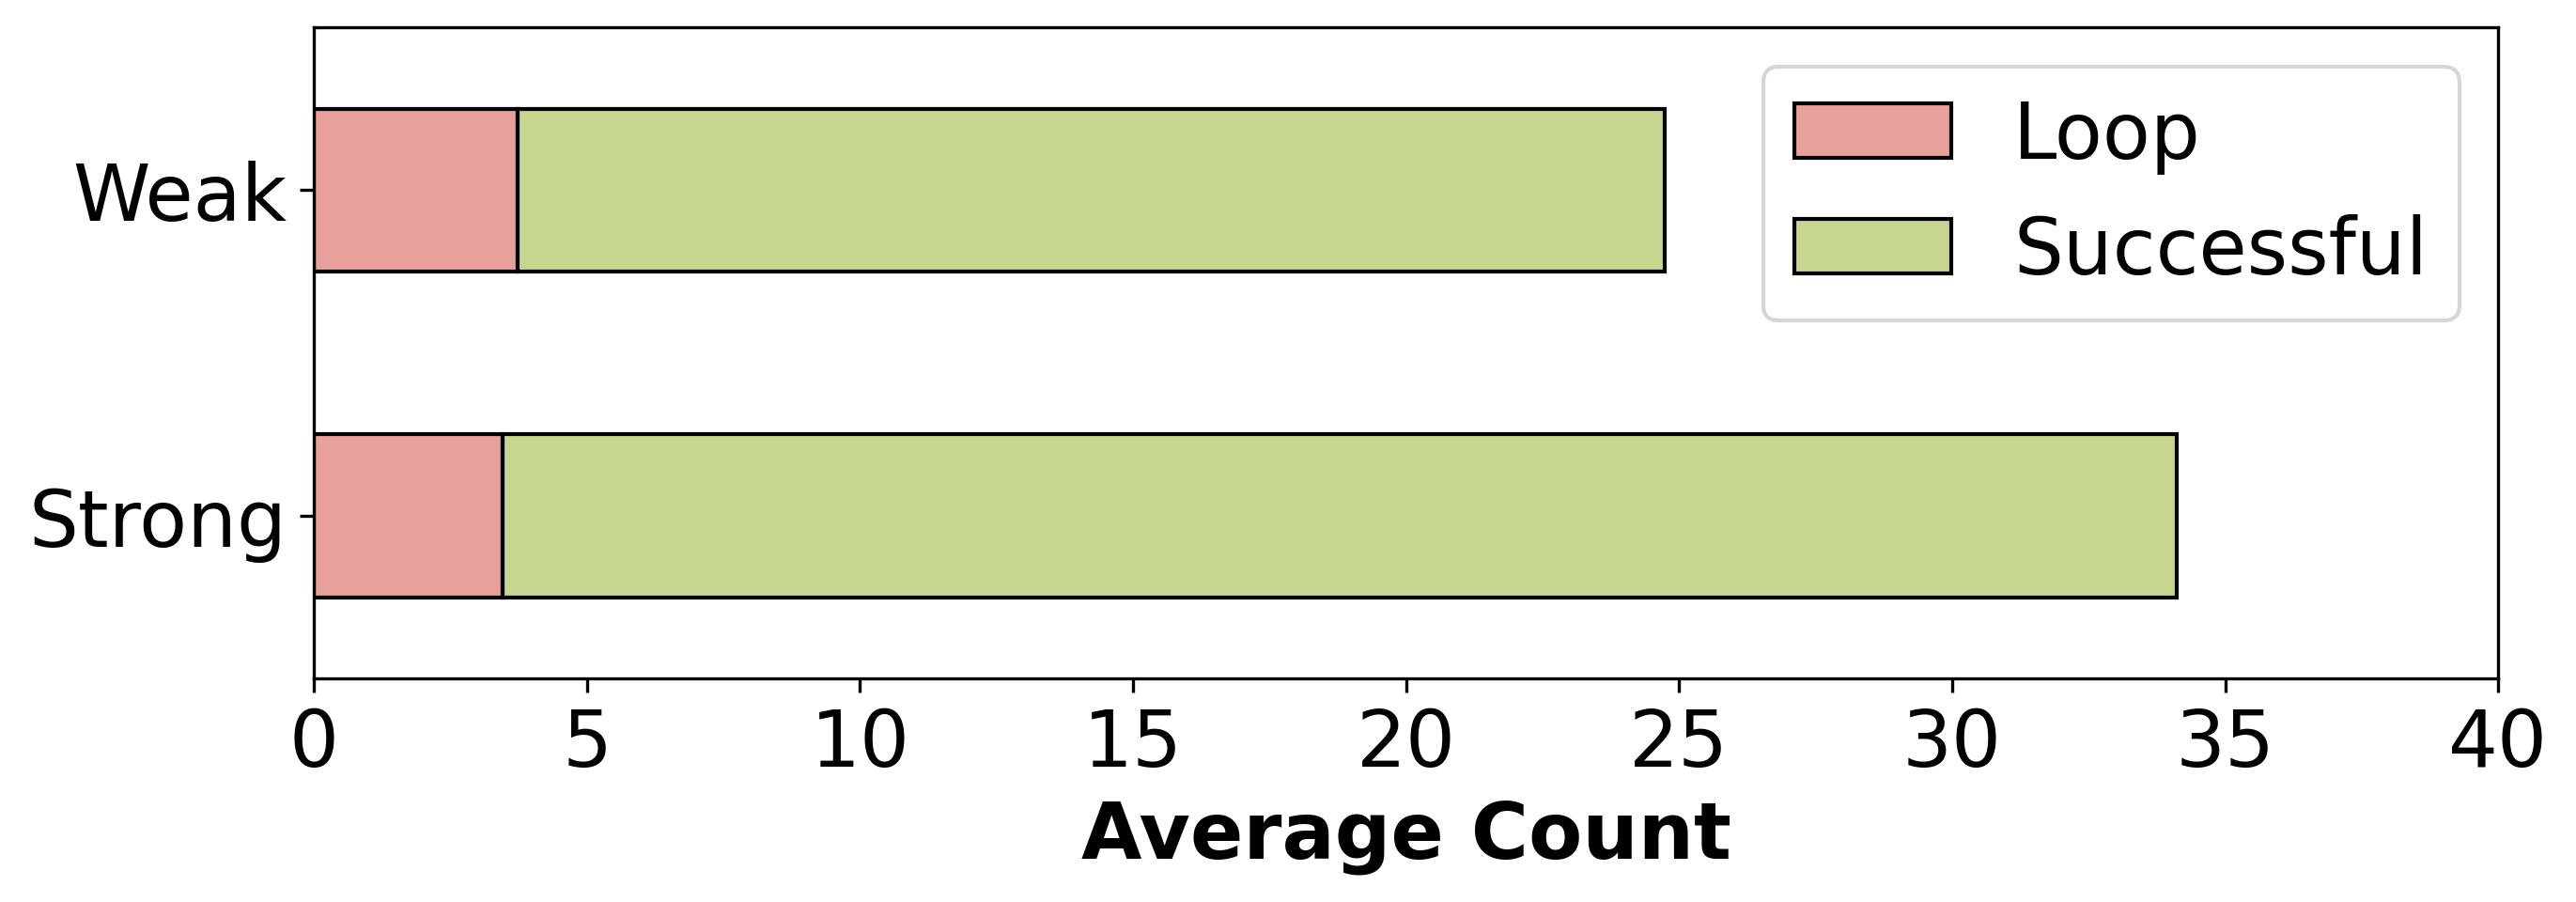
This image presents a stacked horizontal bar chart comparing the average counts of "Loop" and "Successful" events, categorized by "Weak" and "Strong" conditions. The chart visually represents the proportion of each category within each strength level.
### Components/Axes
* **Y-axis (Vertical):** Represents the "Strength" with two categories: "Weak" and "Strong".
* **X-axis (Horizontal):** Represents the "Average Count", ranging from 0 to 40.
* **Legend (Top-Right):**
* Light Red: "Loop"
* Light Green: "Successful"
### Detailed Analysis
The chart consists of two stacked horizontal bars, one for "Weak" and one for "Strong".
**Weak:**
* The "Loop" segment (light red) starts at 0 and extends to approximately 3 on the x-axis. Estimated value: 3.
* The "Successful" segment (light green) starts at approximately 3 and extends to approximately 27 on the x-axis. Estimated value: 24.
* Total for "Weak": Approximately 27.
**Strong:**
* The "Loop" segment (light red) starts at 0 and extends to approximately 5 on the x-axis. Estimated value: 5.
* The "Successful" segment (light green) starts at approximately 5 and extends to approximately 35 on the x-axis. Estimated value: 30.
* Total for "Strong": Approximately 35.
### Key Observations
* The "Successful" count is significantly higher than the "Loop" count for both "Weak" and "Strong" conditions.
* The total average count is higher for the "Strong" condition compared to the "Weak" condition.
* The proportion of "Loop" events appears relatively consistent across both strength levels, while the "Successful" events increase substantially with "Strong" strength.
### Interpretation
The data suggests that the system or process being measured is more frequently "Successful" than in a "Loop" state, regardless of whether the strength is "Weak" or "Strong". The increase in overall count and the dominance of "Successful" events in the "Strong" condition indicate that higher strength correlates with a greater number of successful outcomes. The relatively small "Loop" segments suggest that looping is a less common occurrence, and its frequency doesn't change significantly with strength. This could indicate that the "Loop" state is a transient condition or a less impactful part of the overall process. The chart provides a clear visual comparison of the relative frequencies of these two states under different strength conditions.