## Contour Plots: Minimum Steps and Minimum Examples vs. Parameters
### Overview
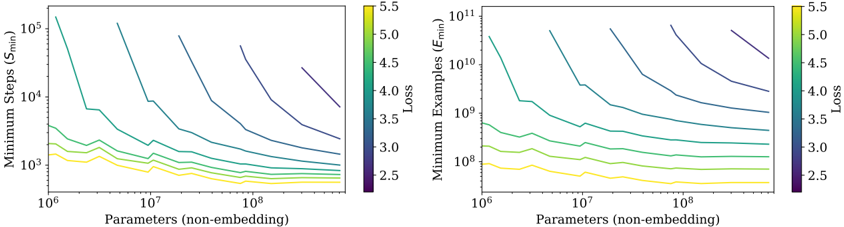
The image contains two contour plots side-by-side. Both plots show the relationship between the number of parameters (non-embedding) of a model and either the minimum steps required for training (left plot) or the minimum examples required for training (right plot). The contours represent different loss values, ranging from 2.5 to 5.5.
### Components/Axes
**Left Plot:**
* **Title:** Minimum Steps (Smin)
* **Y-axis:** Minimum Steps (Smin), logarithmic scale from 10^3 to 10^5
* **X-axis:** Parameters (non-embedding), logarithmic scale from 10^6 to 10^8
* **Contours:** Represent different loss values, color-coded from yellow (2.5) to dark purple (5.5)
* **Colorbar (right side):** Loss, ranging from 2.5 to 5.5
**Right Plot:**
* **Title:** Minimum Examples (Emin)
* **Y-axis:** Minimum Examples (Emin), logarithmic scale from 10^8 to 10^11
* **X-axis:** Parameters (non-embedding), logarithmic scale from 10^6 to 10^8
* **Contours:** Represent different loss values, color-coded from yellow (2.5) to dark purple (5.5)
* **Colorbar (right side):** Loss, ranging from 2.5 to 5.5
**Colorbar (present on both plots):**
* Located on the right side of each plot.
* Represents the Loss values.
* Ranges from 2.5 (yellow) to 5.5 (dark purple).
* Intermediate values: 3.0 (light green), 3.5 (green), 4.0 (light blue), 4.5 (blue), 5.0 (dark blue).
### Detailed Analysis
**Left Plot: Minimum Steps (Smin) vs. Parameters**
* **Loss = 2.5 (Yellow):** The line starts at approximately 10^6 parameters and ~1000 steps, remaining relatively flat until ~3 * 10^7 parameters, then slightly increases.
* **Loss = 3.0 (Light Green):** The line starts at approximately 10^6 parameters and ~1000 steps, remaining relatively flat until ~3 * 10^7 parameters, then slightly increases.
* **Loss = 3.5 (Green):** The line starts at approximately 10^6 parameters and ~1000 steps, remaining relatively flat until ~3 * 10^7 parameters, then slightly increases.
* **Loss = 4.0 (Light Blue):** The line starts at approximately 10^6 parameters and ~2000 steps, decreasing until ~3 * 10^7 parameters, then slightly increases.
* **Loss = 4.5 (Blue):** The line starts at approximately 10^6 parameters and ~5000 steps, decreasing until ~3 * 10^7 parameters, then slightly increases.
* **Loss = 5.0 (Dark Blue):** The line starts at approximately 10^6 parameters and ~10000 steps, decreasing until ~3 * 10^7 parameters, then slightly increases.
* **Loss = 5.5 (Dark Purple):** The line starts at approximately 10^6 parameters and ~50000 steps, decreasing until ~3 * 10^7 parameters, then slightly increases.
**Right Plot: Minimum Examples (Emin) vs. Parameters**
* **Loss = 2.5 (Yellow):** The line starts at approximately 10^6 parameters and ~10^8 examples, remaining relatively flat until ~3 * 10^7 parameters, then slightly increases.
* **Loss = 3.0 (Light Green):** The line starts at approximately 10^6 parameters and ~2 * 10^8 examples, decreasing until ~3 * 10^7 parameters, then slightly increases.
* **Loss = 3.5 (Green):** The line starts at approximately 10^6 parameters and ~5 * 10^8 examples, decreasing until ~3 * 10^7 parameters, then slightly increases.
* **Loss = 4.0 (Light Blue):** The line starts at approximately 10^6 parameters and ~10^9 examples, decreasing until ~3 * 10^7 parameters, then slightly increases.
* **Loss = 4.5 (Blue):** The line starts at approximately 10^6 parameters and ~3 * 10^9 examples, decreasing until ~3 * 10^7 parameters, then slightly increases.
* **Loss = 5.0 (Dark Blue):** The line starts at approximately 10^6 parameters and ~10^10 examples, decreasing until ~3 * 10^7 parameters, then slightly increases.
* **Loss = 5.5 (Dark Purple):** The line starts at approximately 10^6 parameters and ~3 * 10^10 examples, decreasing until ~3 * 10^7 parameters, then slightly increases.
### Key Observations
* For both plots, as the loss increases (from yellow to dark purple), the minimum steps/examples required for training also increase.
* In both plots, the lines tend to flatten out or slightly increase after a parameter count of approximately 3 * 10^7.
* The y-axis scales are different, with the right plot showing minimum examples in the range of 10^8 to 10^11, while the left plot shows minimum steps in the range of 10^3 to 10^5.
### Interpretation
The plots suggest that for a given number of parameters, achieving a lower loss requires fewer training steps and fewer training examples. However, there appears to be a point of diminishing returns around 3 * 10^7 parameters, after which increasing the number of parameters does not significantly reduce the number of steps or examples needed for training. The relationship between model size (number of parameters), training effort (steps/examples), and achievable loss is complex. The plots indicate that increasing model size can initially reduce the training effort required to achieve a certain loss, but beyond a certain point, further increases in model size provide less benefit. This could be due to overfitting or other factors.