## Causal Diagram: Job Hiring Selection
### Overview
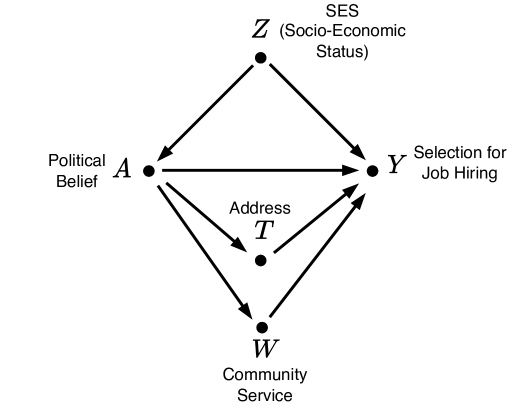
The image is a causal diagram illustrating the relationships between various factors influencing job hiring selection. The diagram uses nodes to represent variables and arrows to indicate causal relationships.
### Components/Axes
* **Nodes:** Represented by circles, each labeled with a variable.
* A: Political Belief
* Z: SES (Socio-Economic Status)
* Y: Selection for Job Hiring
* T: Address
* W: Community Service
* **Arrows:** Indicate the direction of causal influence.
### Detailed Analysis
* **A (Political Belief) directly influences Y (Selection for Job Hiring).** This is represented by a horizontal arrow pointing from A to Y.
* **Z (SES) influences Y (Selection for Job Hiring).** This is represented by an arrow pointing from Z to Y.
* **A (Political Belief) influences Z (SES).** This is represented by an arrow pointing from A to Z.
* **A (Political Belief) influences T (Address).** This is represented by an arrow pointing from A to T.
* **A (Political Belief) influences W (Community Service).** This is represented by an arrow pointing from A to W.
* **T (Address) influences Y (Selection for Job Hiring).** This is represented by an arrow pointing from T to Y.
* **W (Community Service) influences Y (Selection for Job Hiring).** This is represented by an arrow pointing from W to Y.
### Key Observations
* Political Belief (A) has a direct influence on Job Hiring (Y) and also influences other factors like Socio-Economic Status (Z), Address (T), and Community Service (W).
* Socio-Economic Status (Z), Address (T), and Community Service (W) all influence Job Hiring (Y).
### Interpretation
The diagram suggests that political belief can directly influence job hiring decisions. It also shows that political belief can indirectly influence job hiring through its impact on socio-economic status, address, and community service. The diagram highlights the complex interplay of factors that can contribute to job hiring selection, and suggests that political belief may be a significant, albeit potentially indirect, factor. The diagram does not provide any quantitative data, but rather illustrates the hypothesized causal relationships between the variables.