## Bar Chart: Latency vs. Batch Size
### Overview
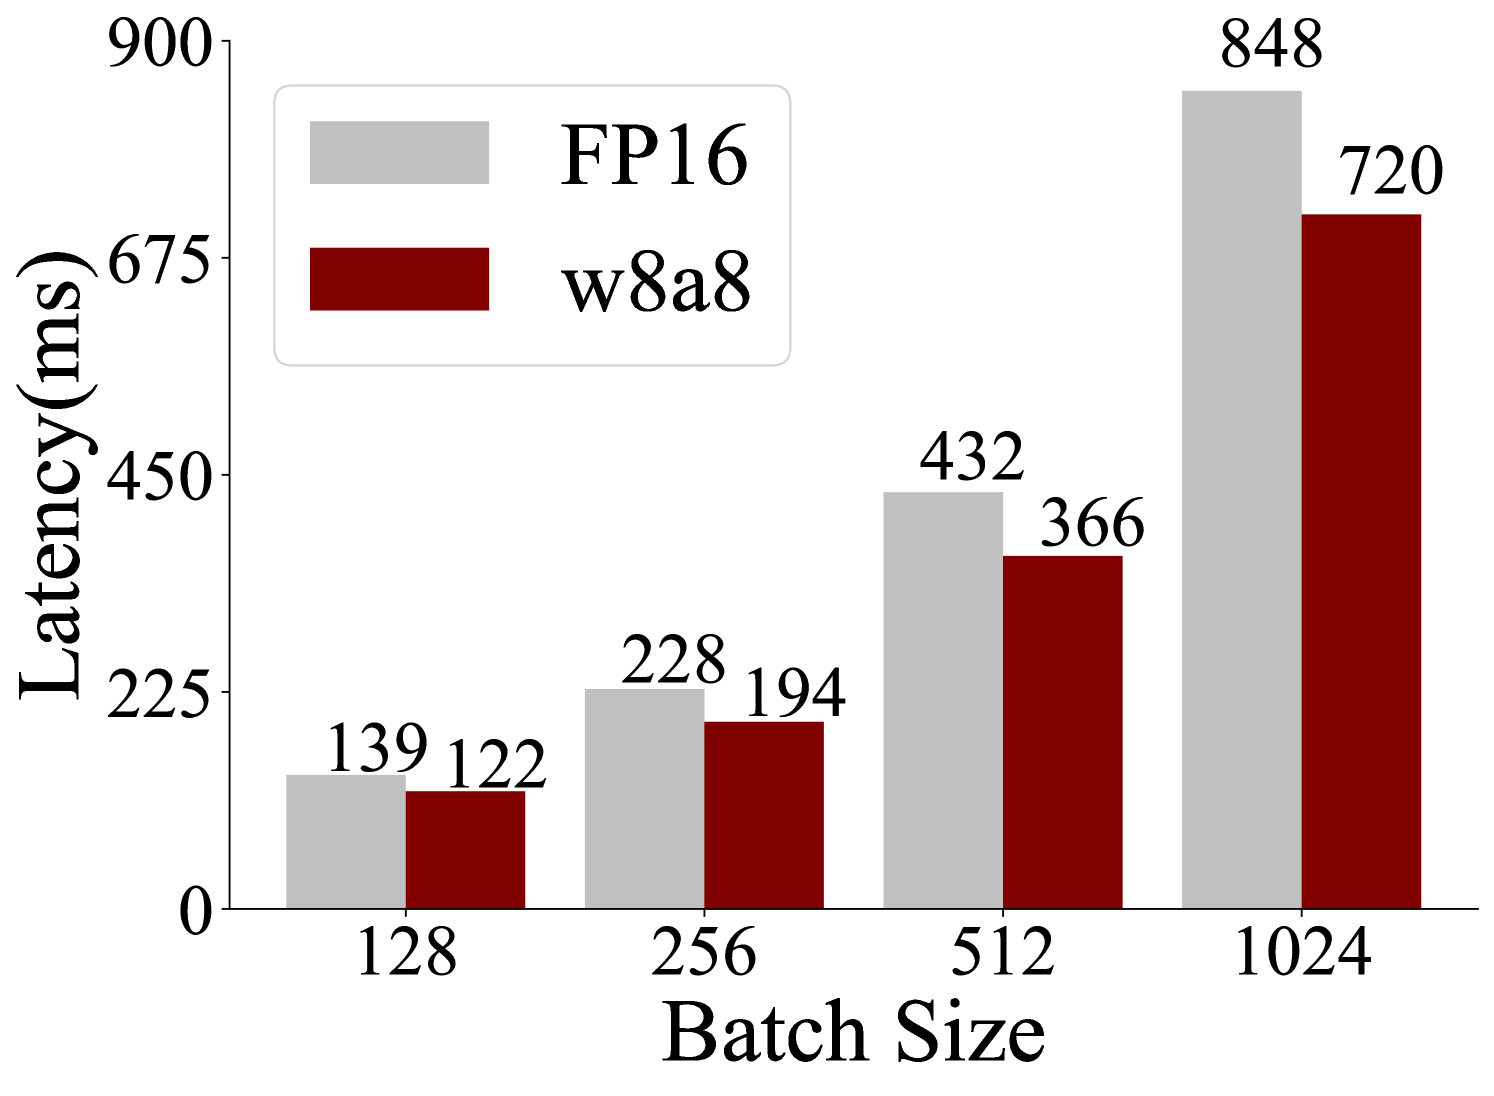
The image is a bar chart comparing the latency (in milliseconds) of two different configurations, FP16 and w8a8, across varying batch sizes (128, 256, 512, and 1024). The chart visually represents how latency increases with batch size for both configurations.
### Components/Axes
* **Title:** There is no explicit title on the chart.
* **X-axis:** "Batch Size" with values 128, 256, 512, and 1024.
* **Y-axis:** "Latency(ms)" with values 0, 225, 450, 675, and 900.
* **Legend:** Located in the top-left corner.
* FP16: Represented by light gray bars.
* w8a8: Represented by dark red bars.
### Detailed Analysis
The chart presents latency measurements for FP16 (light gray) and w8a8 (dark red) at different batch sizes.
* **Batch Size 128:**
* FP16: Latency is approximately 139 ms.
* w8a8: Latency is approximately 122 ms.
* **Batch Size 256:**
* FP16: Latency is approximately 228 ms.
* w8a8: Latency is approximately 194 ms.
* **Batch Size 512:**
* FP16: Latency is approximately 432 ms.
* w8a8: Latency is approximately 366 ms.
* **Batch Size 1024:**
* FP16: Latency is approximately 848 ms.
* w8a8: Latency is approximately 720 ms.
**Trend Verification:**
Both FP16 and w8a8 show an upward trend in latency as the batch size increases.
### Key Observations
* For all batch sizes, w8a8 consistently exhibits lower latency compared to FP16.
* The difference in latency between FP16 and w8a8 appears to increase as the batch size increases.
### Interpretation
The data suggests that the w8a8 configuration is more efficient (lower latency) than FP16 across all tested batch sizes. The increasing difference in latency with larger batch sizes indicates that w8a8 scales better than FP16. This could be due to the quantization benefits of w8a8, which reduce memory bandwidth requirements and computational complexity, especially at larger batch sizes.
```