## Bar Chart: Latency vs. Batch Size for FP16 and w8a8 Precision Formats
### Overview
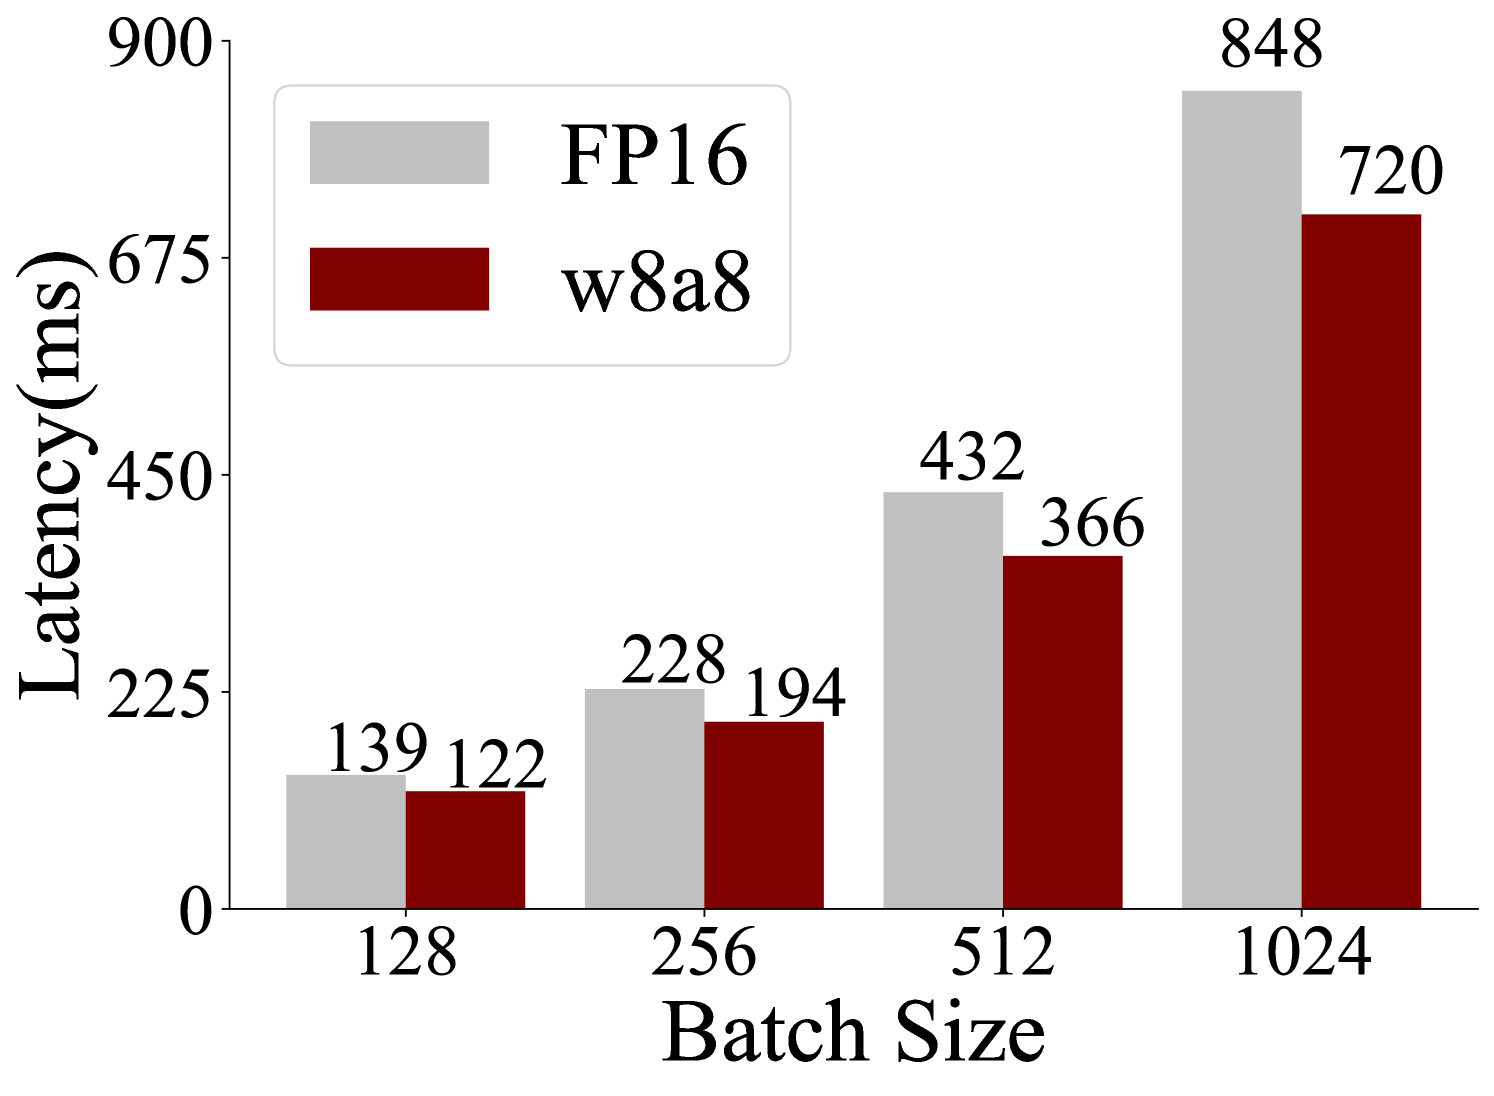
This is a grouped bar chart comparing the inference latency (in milliseconds) of two different numerical precision formats—FP16 (16-bit floating point) and w8a8 (likely 8-bit weights and 8-bit activations)—across four different batch sizes. The chart demonstrates that latency increases with batch size for both formats, but the w8a8 format consistently exhibits lower latency than FP16.
### Components/Axes
* **Chart Type:** Grouped vertical bar chart.
* **X-Axis:** Labeled **"Batch Size"**. It has four discrete categories: `128`, `256`, `512`, and `1024`.
* **Y-Axis:** Labeled **"Latency(ms)"**. The scale is linear, with major tick marks at 0, 225, 450, 675, and 900.
* **Legend:** Located in the top-left quadrant of the chart area.
* A light gray rectangle corresponds to the label **"FP16"**.
* A dark red (maroon) rectangle corresponds to the label **"w8a8"**.
* **Data Labels:** The exact latency value is printed directly above each bar.
### Detailed Analysis
The chart presents the following precise data points, confirmed by matching bar color to legend and reading the labels:
| Batch Size | FP16 Latency (ms) | w8a8 Latency (ms) |
| :--- | :--- | :--- |
| **128** | 139 | 122 |
| **256** | 228 | 194 |
| **512** | 432 | 366 |
| **1024** | 848 | 720 |
**Trend Verification:**
* **FP16 Series (Light Gray Bars):** The line formed by the tops of the light gray bars slopes sharply upward from left to right. Latency increases monotonically and significantly with batch size, growing from 139 ms at batch size 128 to 848 ms at batch size 1024.
* **w8a8 Series (Dark Red Bars):** The line formed by the tops of the dark red bars also slopes upward from left to right, but remains consistently below the FP16 series. Latency increases from 122 ms at batch size 128 to 720 ms at batch size 1024.
### Key Observations
1. **Consistent Performance Advantage:** For every batch size tested, the w8a8 format has lower latency than the FP16 format.
2. **Widening Performance Gap:** The absolute difference in latency between FP16 and w8a8 grows as the batch size increases.
* At batch size 128, the difference is 17 ms.
* At batch size 1024, the difference is 128 ms.
3. **Non-Linear Scaling:** The increase in latency is not linear with the batch size. Doubling the batch size from 512 to 1024 results in a near-doubling of latency for both formats (FP16: 432ms → 848ms; w8a8: 366ms → 720ms), suggesting a roughly linear relationship between batch size and latency within this range.
### Interpretation
This chart provides empirical evidence for the performance benefits of using lower-precision arithmetic (w8a8) in computational workloads, likely machine learning model inference, compared to higher-precision arithmetic (FP16).
* **What the data suggests:** The w8a8 format offers a consistent and scalable reduction in processing time (latency) compared to FP16. The benefit becomes more pronounced at larger batch sizes, which are common in high-throughput serving scenarios.
* **How elements relate:** The x-axis (Batch Size) is the independent variable, representing the workload. The y-axis (Latency) is the dependent variable, measuring performance. The two series (FP16, w8a8) represent different system configurations. The chart directly visualizes the trade-off: adopting w8a8 quantization reduces latency for a given workload.
* **Notable implications:** The data implies that for applications where inference speed is critical, especially at scale (large batch sizes), implementing w8a8 quantization could yield significant performance improvements over FP16. The near-linear scaling suggests predictable performance characteristics, which is valuable for capacity planning. The chart does not show accuracy or quality metrics, so the interpretation is strictly about computational speed.