## Bar Chart: Latency Comparison Between FP16 and w8a8 Methods
### Overview
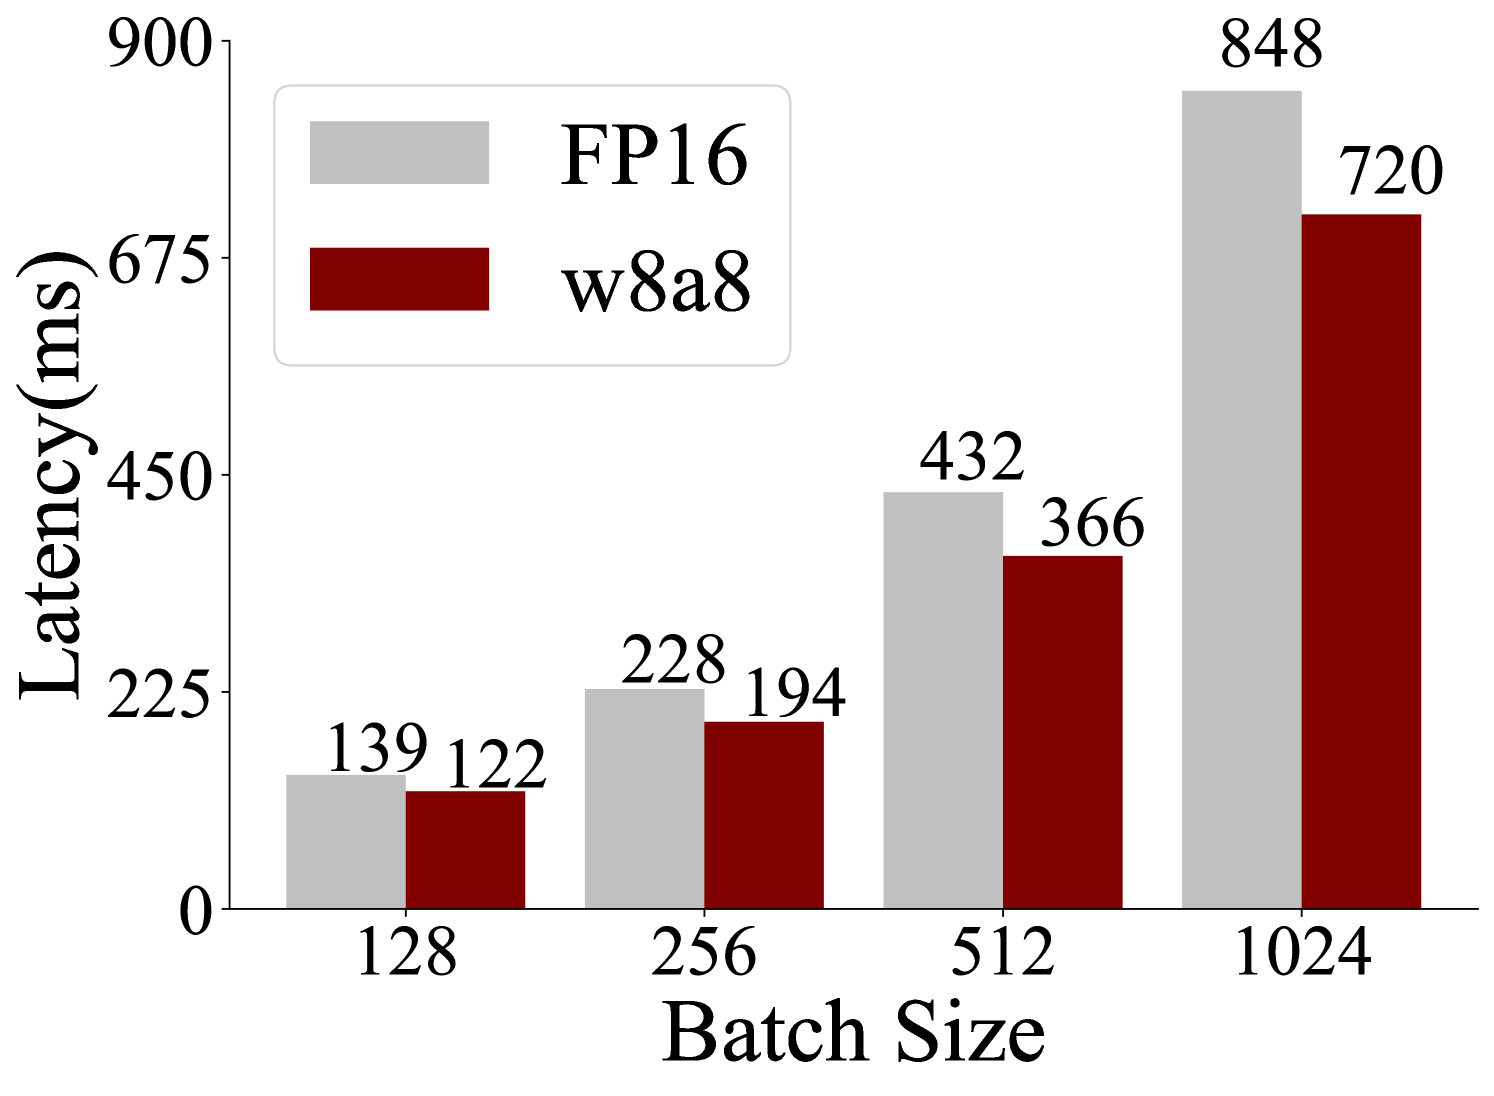
The chart compares latency (in milliseconds) for two computational methods, FP16 and w8a8, across four batch sizes: 128, 256, 512, and 1024. Two bars are shown per batch size, with FP16 represented in gray and w8a8 in red. Latency values are labeled on top of each bar.
### Components/Axes
- **X-axis (Batch Size)**: Labeled "Batch Size" with categories 128, 256, 512, and 1024.
- **Y-axis (Latency)**: Labeled "Latency (ms)" with a scale from 0 to 900.
- **Legend**: Located in the top-left corner, indicating:
- Gray bars: FP16
- Red bars: w8a8
### Detailed Analysis
- **Batch Size 128**:
- FP16: 139 ms
- w8a8: 122 ms
- **Batch Size 256**:
- FP16: 228 ms
- w8a8: 194 ms
- **Batch Size 512**:
- FP16: 432 ms
- w8a8: 366 ms
- **Batch Size 1024**:
- FP16: 848 ms
- w8a8: 720 ms
### Key Observations
1. **Consistent Performance Gap**: w8a8 consistently exhibits lower latency than FP16 across all batch sizes.
2. **Scaling Trends**:
- Both methods show increasing latency with larger batch sizes.
- The efficiency gap widens at larger batches (e.g., 128 ms difference at 1024 vs. 17 ms at 128).
3. **FP16 Limitations**: FP16 latency grows disproportionately at 1024 batch size (848 ms), nearing the y-axis maximum.
### Interpretation
The data demonstrates that w8a8 is significantly more efficient than FP16 in terms of latency, with the performance advantage becoming more pronounced as batch size increases. This suggests w8a8 may be better suited for high-throughput or latency-sensitive applications. The FP16 method’s latency spikes at 1024 batch size could indicate hardware/software bottlenecks or suboptimal optimization for large-scale operations. The trend highlights the importance of method selection based on computational constraints and performance requirements.