## Bar Chart: Model Performance Across Confidence Levels
### Overview
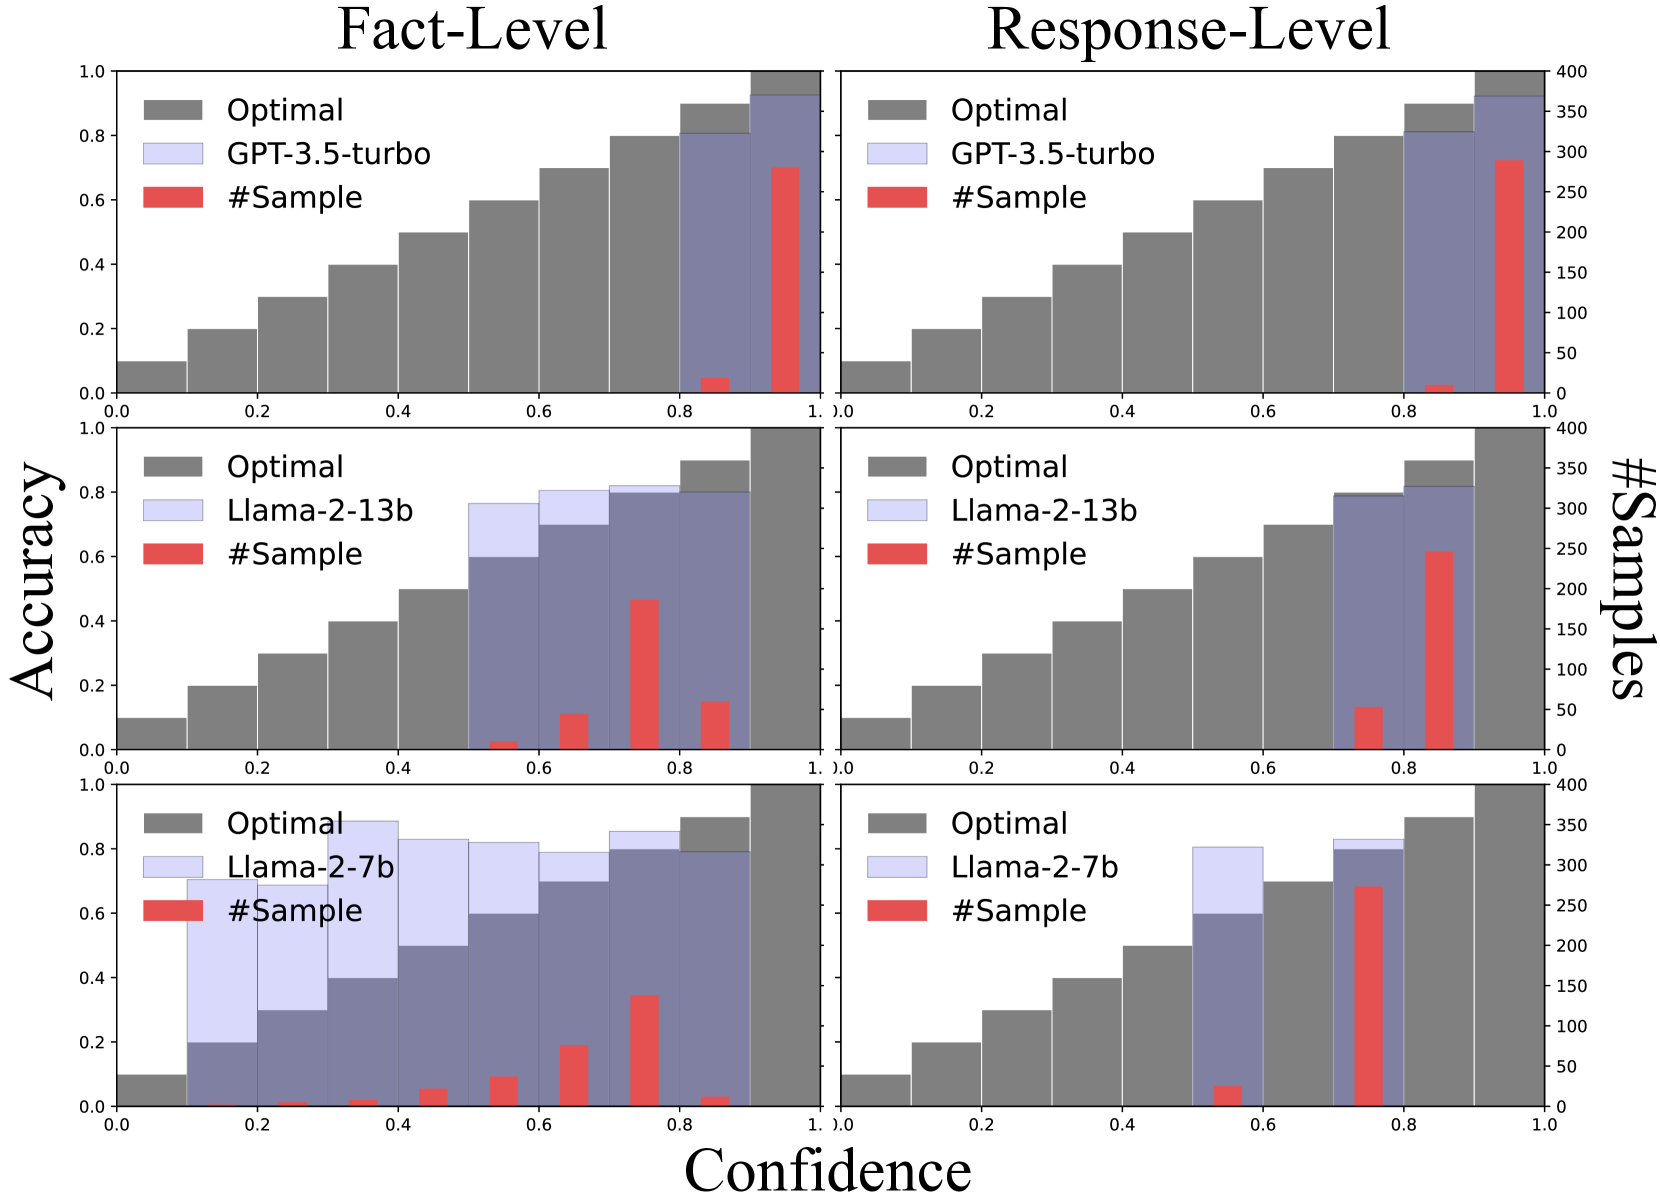
The image contains six grouped bar charts comparing model performance (accuracy and sample counts) across confidence thresholds (0.0–1.0). Models are categorized into "Optimal," "GPT-3.5-turbo," and "Llama-2-13b/7b" across two domains: "Fact-Level" and "Response-Level." Each chart uses color-coded bars to represent model performance metrics.
---
### Components/Axes
- **X-Axis (Confidence)**: Labeled "Confidence" with increments at 0.0, 0.2, 0.4, 0.6, 0.8, and 1.0.
- **Y-Axes**:
- **Left (Accuracy)**: Labeled "Accuracy" with increments from 0.0 to 1.0.
- **Right (#Samples)**: Labeled "#Samples" with increments from 0 to 400.
- **Legends**:
- **Optimal**: Gray bars.
- **GPT-3.5-turbo**: Purple bars.
- **Llama-2-13b/7b**: Red bars.
- **Subplots**:
- **Top Row**: Fact-Level performance (GPT-3.5-turbo and Llama-2-13b).
- **Middle Row**: Fact-Level performance (Llama-2-13b).
- **Bottom Row**: Response-Level performance (Llama-2-7b).
---
### Detailed Analysis
#### Fact-Level (GPT-3.5-turbo vs. Llama-2-13b)
- **Optimal**: Accuracy increases steadily from ~0.1 at 0.0 confidence to ~0.9 at 1.0 confidence. Sample counts rise from ~50 to ~400.
- **GPT-3.5-turbo**: Accuracy peaks at ~0.75 at 0.8 confidence. Sample counts plateau at ~300.
- **Llama-2-13b**: Accuracy peaks at ~0.6 at 0.8 confidence. Sample counts peak at ~150.
#### Response-Level (Llama-2-7b)
- **Optimal**: Accuracy reaches ~0.95 at 1.0 confidence. Sample counts rise to ~400.
- **GPT-3.5-turbo**: Accuracy peaks at ~0.85 at 0.8 confidence. Sample counts stabilize at ~350.
- **Llama-2-7b**: Accuracy peaks at ~0.7 at 0.8 confidence. Sample counts peak at ~250.
---
### Key Observations
1. **Optimal Models Dominate**: Optimal models consistently achieve the highest accuracy and require the most samples across all confidence levels.
2. **GPT-3.5-turbo vs. Llama**: GPT-3.5-turbo outperforms Llama models in both domains, with larger margins in Response-Level tasks.
3. **Confidence-Accuracy Correlation**: Accuracy improves with confidence for all models, but Optimal models show the steepest improvement.
4. **Sample Efficiency**: Higher confidence predictions correlate with fewer required samples (e.g., Optimal models at 1.0 confidence use ~400 samples vs. ~50 at 0.0 confidence).
---
### Interpretation
The data suggests that **Optimal models** are the most reliable, achieving near-perfect accuracy at high confidence while requiring substantial sample sizes. **GPT-3.5-turbo** balances performance and efficiency, outperforming Llama models but lagging behind Optimal. **Llama models** underperform in both domains, particularly in Response-Level tasks, where their accuracy gaps widen. The inverse relationship between confidence and sample counts implies that models become more certain with fewer data points as confidence thresholds increase, though this trend is less pronounced in Llama models. The distinction between Fact-Level and Response-Level performance highlights the complexity of response generation tasks compared to factual recall.