# Technical Document Extraction: Scatter Plot Analysis
## Image Type
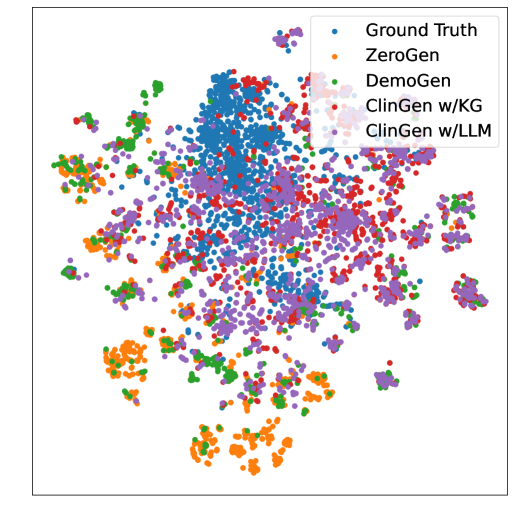
- **Scatter Plot** with no defined axis titles or numerical markers.
## Legend
| Color | Label |
|-------------|---------------------|
| Blue | Ground Truth |
| Orange | ZeroGen |
| Purple | DemoGen |
| Red | ClinGen w/KG |
| Green | ClinGen w/LLM |
## Key Observations
1. **Cluster Distribution**:
- **Ground Truth (Blue)**: Most densely concentrated cluster, forming a cohesive central group.
- **DemoGen (Purple)**: Second-largest cluster, slightly dispersed but maintains moderate density.
- **ClinGen w/KG (Red)** and **ClinGen w/LLM (Green)**: Overlapping, less dense clusters with significant spatial separation from Ground Truth.
- **ZeroGen (Orange)**: Smallest, most dispersed cluster, with minimal density.
2. **Spatial Relationships**:
- Ground Truth and DemoGen clusters are spatially closest, suggesting potential similarity in underlying data.
- ClinGen variants (w/KG and w/LLM) are more isolated, indicating distinct groupings.
- ZeroGen points are scattered throughout the plot, showing no clear clustering.
## Structural Notes
- No axis labels, scales, or numerical markers are present in the image.
- All data points are represented as uniformly sized dots without additional annotations.
- Legend colors match the corresponding data point colors in the plot (verified cross-referencing).
## Conclusion
The plot visualizes categorical groupings of data points, with Ground Truth and DemoGen forming the most cohesive clusters. ClinGen variants and ZeroGen exhibit lower density and greater dispersion, suggesting differences in data characteristics or model performance.