## Heatmap: MIND - Core Generalization - Qwen-2.5 1.5B
### Overview
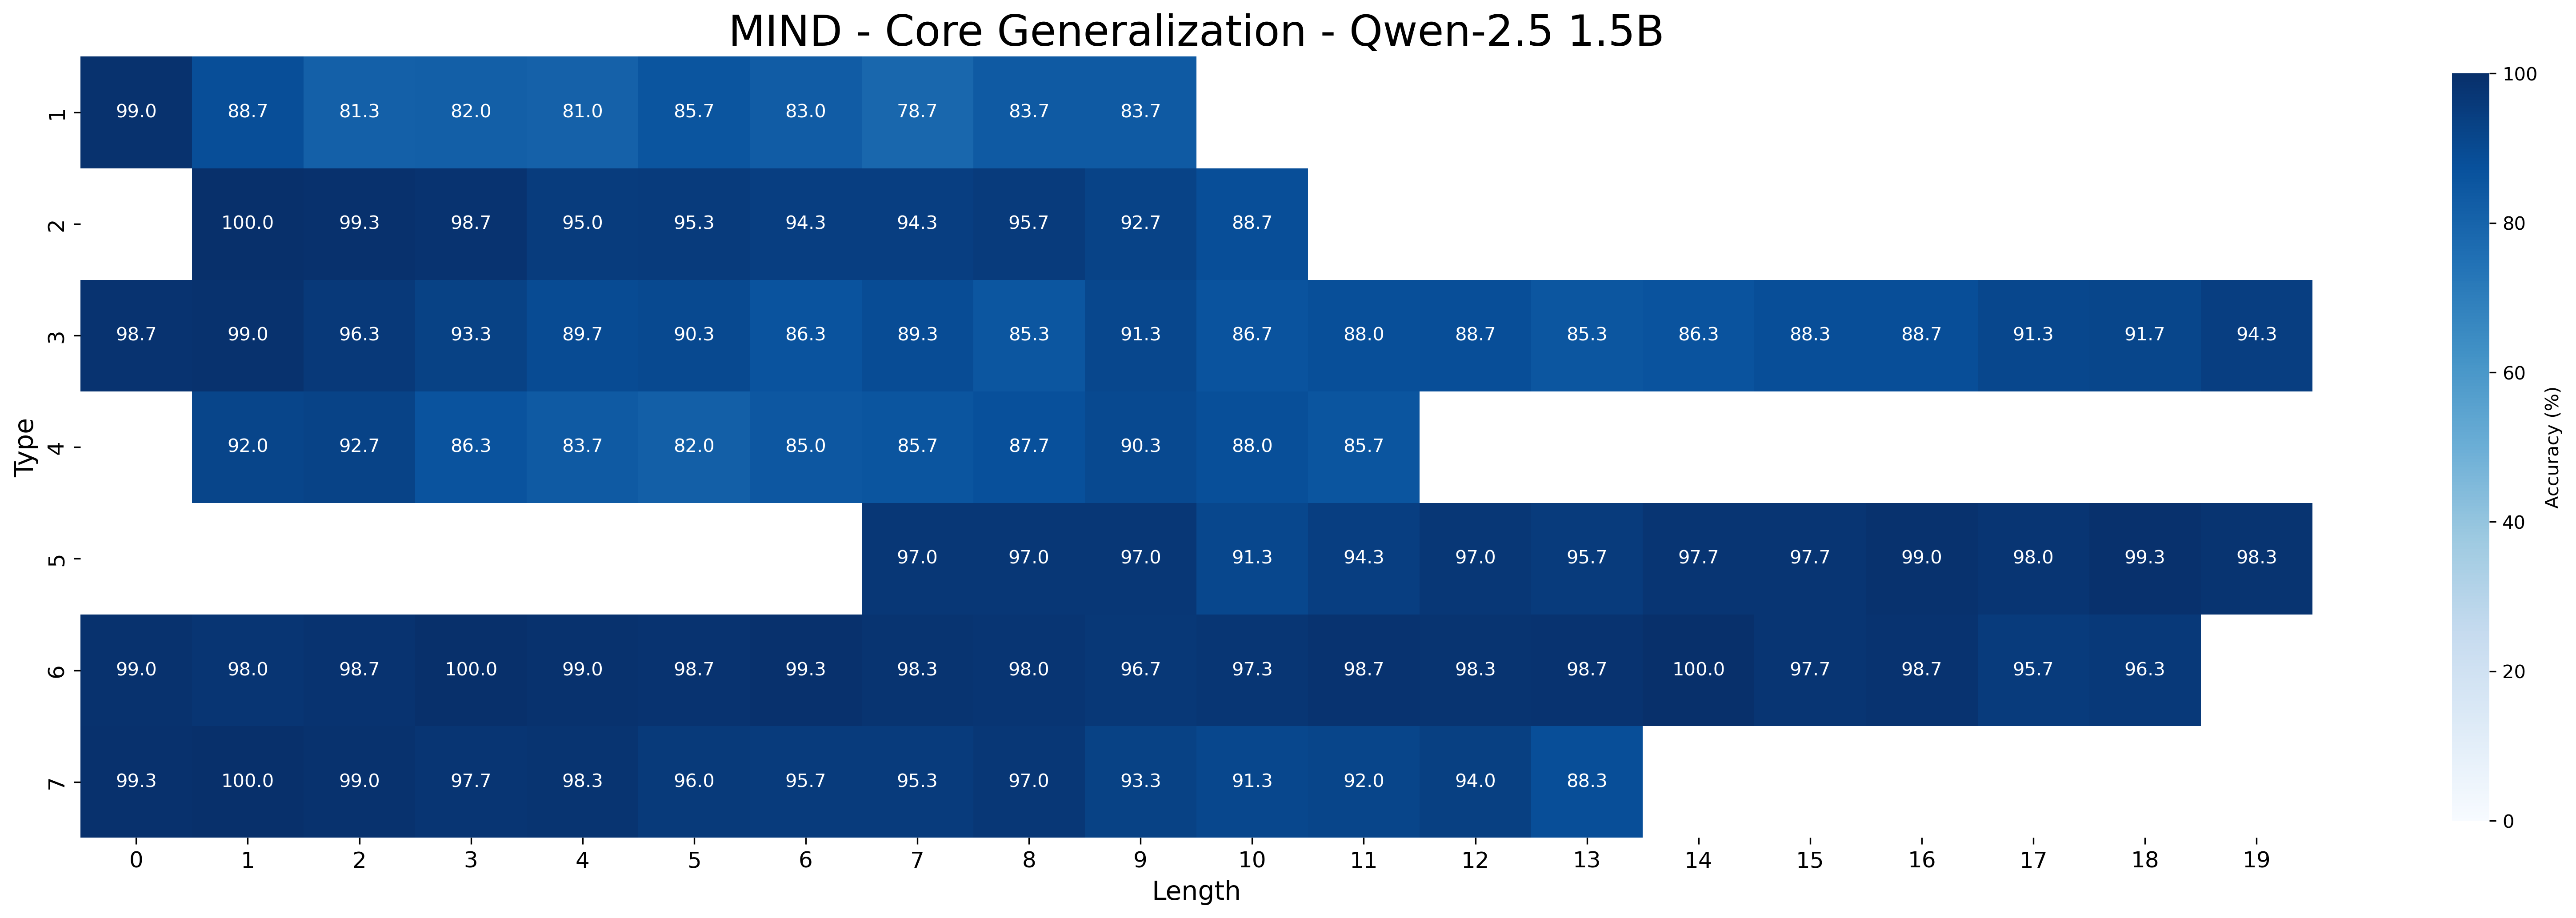
The image is a heatmap visualizing the accuracy of a model (MIND - Core Generalization - Qwen-2.5 1.5B) across different types and lengths. The heatmap uses a color gradient from light blue to dark blue to represent accuracy percentages, ranging from 0% to 100%. The x-axis represents the length, and the y-axis represents the type.
### Components/Axes
* **Title:** MIND - Core Generalization - Qwen-2.5 1.5B
* **X-axis:** Length (ranging from 0 to 19)
* **Y-axis:** Type (ranging from 1 to 7)
* **Colorbar (Accuracy %):** Ranges from 0% (lightest blue) to 100% (darkest blue)
### Detailed Analysis
The heatmap displays accuracy values for different combinations of "Type" (1-7) and "Length" (0-19). Each cell in the heatmap represents the accuracy for a specific Type and Length combination. The color intensity corresponds to the accuracy percentage, with darker blues indicating higher accuracy.
Here's a breakdown of the accuracy values for each type across different lengths:
* **Type 1:**
* Length 0: 99.0%
* Length 1: 88.7%
* Length 2: 81.3%
* Length 3: 82.0%
* Length 4: 81.0%
* Length 5: 85.7%
* Length 6: 83.0%
* Length 7: 78.7%
* Length 8: 83.7%
* Length 9: 83.7%
* **Type 2:**
* Length 0: 100.0%
* Length 1: 99.3%
* Length 2: 98.7%
* Length 3: 95.0%
* Length 4: 95.3%
* Length 5: 94.3%
* Length 6: 94.3%
* Length 7: 95.7%
* Length 8: 92.7%
* Length 9: 88.7%
* **Type 3:**
* Length 0: 98.7%
* Length 1: 99.0%
* Length 2: 96.3%
* Length 3: 93.3%
* Length 4: 89.7%
* Length 5: 90.3%
* Length 6: 86.3%
* Length 7: 89.3%
* Length 8: 85.3%
* Length 9: 91.3%
* Length 10: 86.7%
* Length 11: 88.0%
* Length 12: 88.7%
* Length 13: 85.3%
* Length 14: 86.3%
* Length 15: 88.3%
* Length 16: 88.7%
* Length 17: 91.3%
* Length 18: 91.7%
* Length 19: 94.3%
* **Type 4:**
* Length 0: 92.0%
* Length 1: 92.7%
* Length 2: 86.3%
* Length 3: 83.7%
* Length 4: 82.0%
* Length 5: 85.0%
* Length 6: 85.7%
* Length 7: 87.7%
* Length 8: 90.3%
* Length 9: 88.0%
* Length 10: 85.7%
* **Type 5:**
* Length 7: 97.0%
* Length 8: 97.0%
* Length 9: 97.0%
* Length 10: 91.3%
* Length 11: 94.3%
* Length 12: 97.0%
* Length 13: 95.7%
* Length 14: 97.7%
* Length 15: 97.7%
* Length 16: 99.0%
* Length 17: 98.0%
* Length 18: 99.3%
* Length 19: 98.3%
* **Type 6:**
* Length 0: 99.0%
* Length 1: 98.0%
* Length 2: 98.7%
* Length 3: 100.0%
* Length 4: 99.0%
* Length 5: 98.7%
* Length 6: 99.3%
* Length 7: 98.3%
* Length 8: 98.0%
* Length 9: 96.7%
* Length 10: 97.3%
* Length 11: 98.7%
* Length 12: 98.3%
* Length 13: 98.7%
* Length 14: 100.0%
* Length 15: 97.7%
* Length 16: 98.7%
* Length 17: 95.7%
* Length 18: 96.3%
* **Type 7:**
* Length 0: 99.3%
* Length 1: 100.0%
* Length 2: 99.0%
* Length 3: 97.7%
* Length 4: 98.3%
* Length 5: 96.0%
* Length 6: 95.7%
* Length 7: 95.3%
* Length 8: 97.0%
* Length 9: 93.3%
* Length 10: 91.3%
* Length 11: 92.0%
* Length 12: 94.0%
* Length 13: 88.3%
### Key Observations
* Types 6 and 7 generally exhibit high accuracy across most lengths.
* Type 5 has accuracy data only for lengths 7-19, and the accuracy is generally high.
* Types 1, 2, 3, and 4 have accuracy data for shorter lengths (0-10).
* Accuracy tends to vary more for shorter lengths compared to longer lengths.
### Interpretation
The heatmap provides insights into the performance of the MIND model across different input types and lengths. The model appears to perform well overall, with many combinations achieving high accuracy (above 90%). Types 6 and 7 seem to be particularly well-suited for the model, consistently achieving high accuracy. The variability in accuracy for shorter lengths might indicate that the model requires a certain amount of context to perform optimally. The lack of data for Type 5 at shorter lengths could be due to design or experimental constraints. Overall, the heatmap suggests that the MIND model is robust and generalizes well across different types and lengths, especially for Types 6 and 7.