## Heatmap: MIND - Core Generalization - Qwen-2.5 1.5B
### Overview
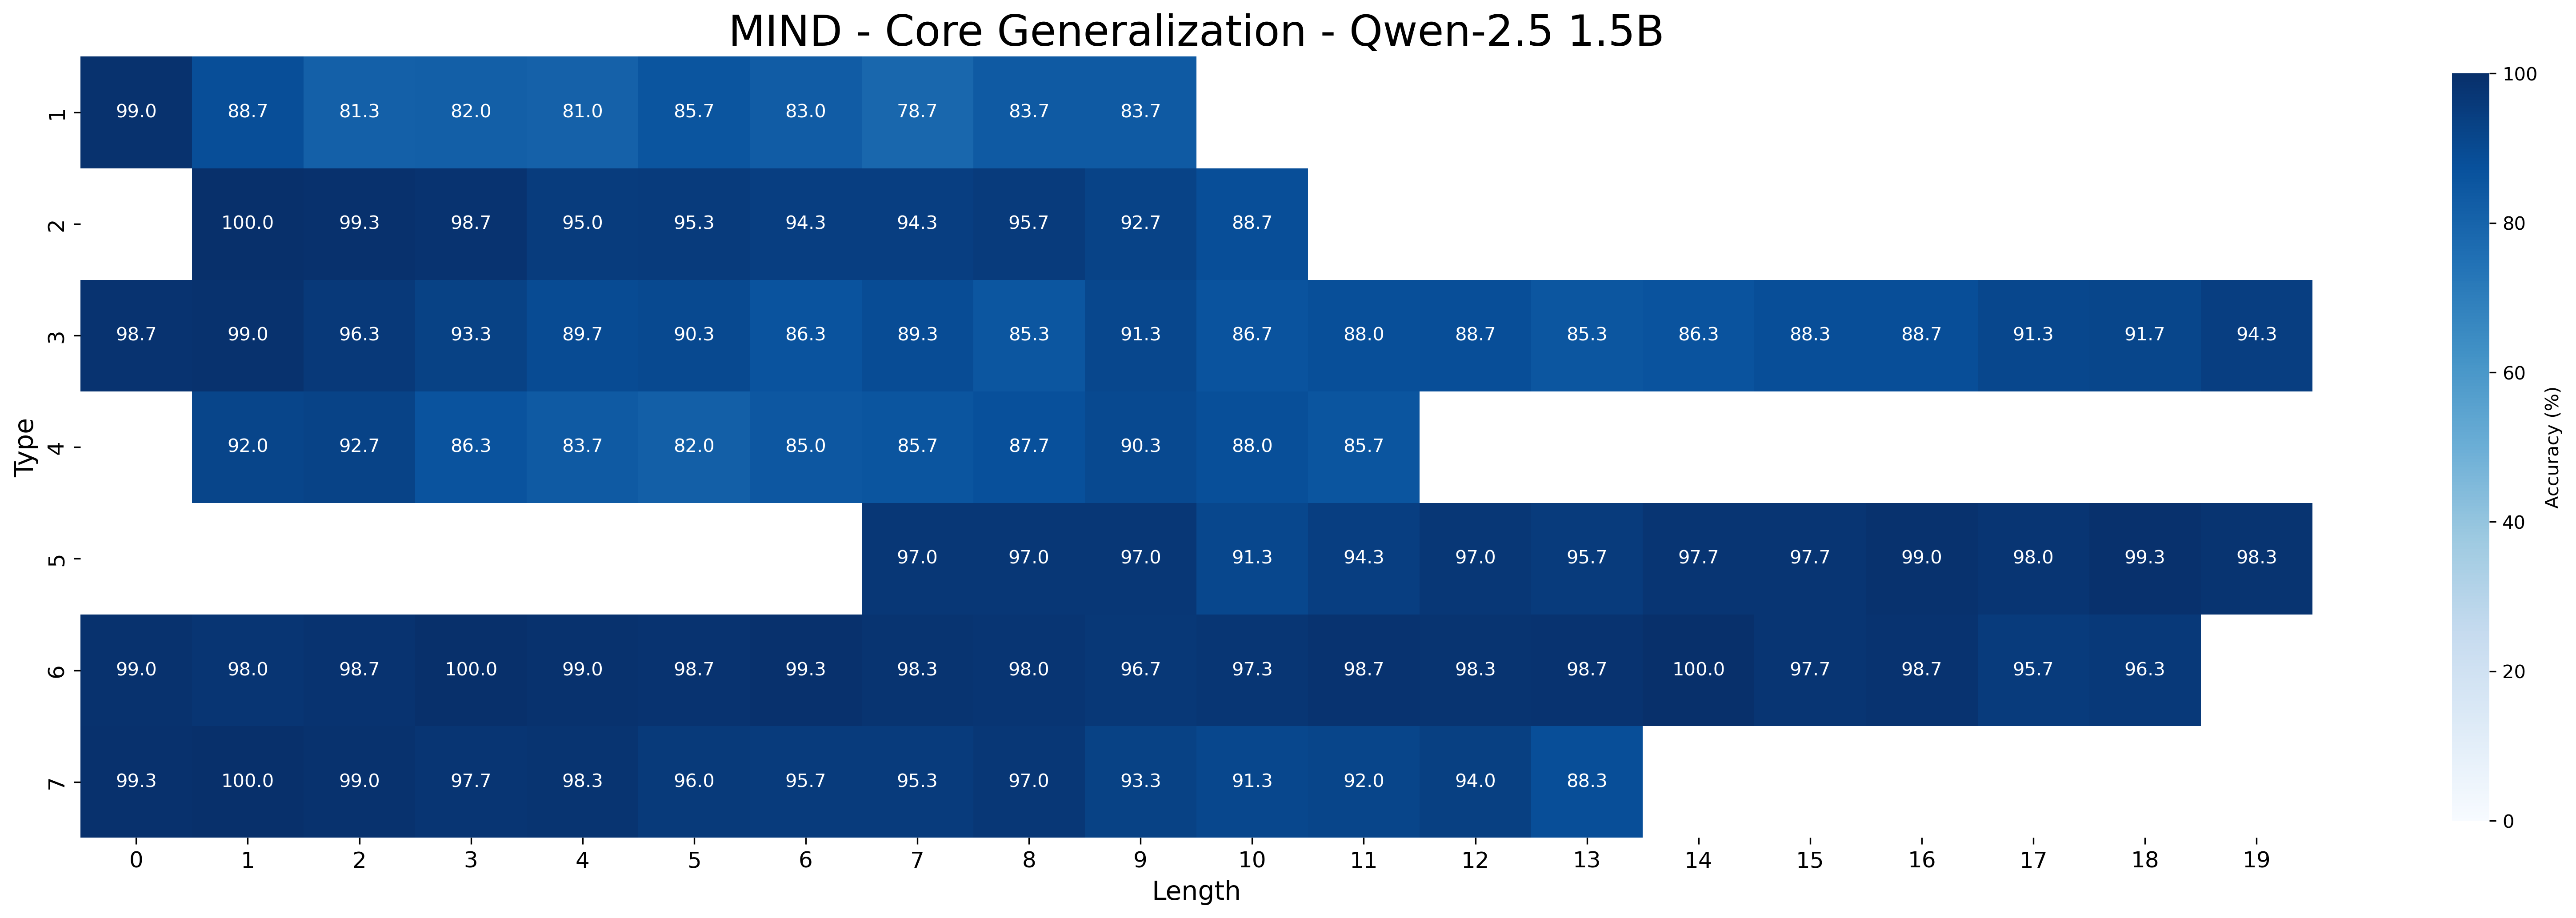
This image presents a heatmap visualizing the accuracy of a model (Qwen-2.5 1.5B) on the MIND dataset, specifically focusing on core generalization. The heatmap displays accuracy as a function of 'Type' and 'Length'. The color gradient represents accuracy percentage, ranging from approximately 0% (dark blue) to 100% (light yellow).
### Components/Axes
* **Title:** MIND - Core Generalization - Qwen-2.5 1.5B (Top-center)
* **X-axis:** Length (ranging from 0 to 19, with integer increments). Located at the bottom.
* **Y-axis:** Type (with categories: '>', 'u', 'm', '4', 'n', 'o'). Located on the left.
* **Colorbar:** A vertical colorbar on the right, representing Accuracy (%) ranging from 0 to 100.
* **Data Points:** Each cell in the heatmap represents the accuracy for a specific combination of 'Type' and 'Length'. The values are displayed within each cell.
### Detailed Analysis
The heatmap is a 6x20 grid. I will analyze each row (Type) and describe the trend of accuracy as length increases.
* **Type >:** Accuracy starts at approximately 99.0% at length 0, decreases to around 81.0% at length 4, then increases again to approximately 83.7% at length 18.
* (0, 99.0), (1, 98.7), (2, 99.0), (3, 81.0), (4, 85.7), (5, 83.0), (6, 83.7), (7, 83.7), (8, 83.7), (9, 88.7)
* (10, 83.0), (11, 83.7), (12, 83.7), (13, 83.7), (14, 83.7), (15, 88.7), (16, 91.3), (17, 91.7), (18, 94.3), (19, 94.3)
* **Type u:** Accuracy starts at 100.0% at length 0, decreases to approximately 95.3% at length 5, and remains relatively stable around 92.7% to 98.7% for lengths 6 to 19.
* (0, 100.0), (1, 99.3), (2, 98.7), (3, 95.0), (4, 94.3), (5, 95.3), (6, 94.3), (7, 95.7), (8, 92.7), (9, 88.7)
* (10, 95.7), (11, 97.7), (12, 99.0), (13, 98.0), (14, 99.3), (15, 98.3), (16, 97.7), (17, 95.7), (18, 96.3), (19, 96.3)
* **Type m:** Accuracy is consistently high, starting at 99.0% at length 0, with minor fluctuations, generally remaining between 88.3% and 99.0% across all lengths.
* (0, 99.0), (1, 96.3), (2, 93.3), (3, 89.7), (4, 90.3), (5, 86.9), (6, 85.3), (7, 91.6), (8, 88.0), (9, 88.7)
* (10, 86.3), (11, 88.3), (12, 91.7), (13, 91.3), (14, 91.7), (15, 88.3), (16, 91.3), (17, 91.7), (18, 94.3), (19, 94.3)
* **Type 4:** Accuracy starts at 92.0% at length 0, decreases to 82.0% at length 4, and increases to 88.0% at length 9, then remains relatively stable around 85.7% to 92.7% for lengths 5 to 19.
* (0, 92.0), (1, 92.7), (2, 86.3), (3, 83.7), (4, 82.0), (5, 85.0), (6, 87.7), (7, 90.0), (8, 88.0), (9, 85.7)
* (10, 97.0), (11, 97.0), (12, 91.3), (13, 94.3), (14, 95.7), (15, 97.7), (16, 99.0), (17, 98.0), (18, 99.3), (19, 98.3)
* **Type n:** Accuracy is generally high, starting at 98.0% at length 0, with minor fluctuations, generally remaining between 94.3% and 99.0% across all lengths.
* (0, 98.0), (1, 100.0), (2, 99.0), (3, 98.7), (4, 98.7), (5, 98.7), (6, 98.0), (7, 96.7), (8, 96.7), (9, 98.7)
* (10, 98.7), (11, 98.7), (12, 98.3), (13, 98.7), (14, 99.0), (15, 98.3), (16, 97.7), (17, 95.7), (18, 96.3), (19, 96.3)
* **Type o:** Accuracy is consistently very high, starting at 100.0% at length 0, and remaining above 95.7% for all lengths.
* (0, 100.0), (1, 99.7), (2, 99.0), (3, 98.3), (4, 96.0), (5, 95.7), (6, 97.0), (7, 97.0), (8, 93.3), (9, 92.0)
* (10, 95.3), (11, 97.0), (12, 98.7), (13, 98.7), (14, 98.7), (15, 98.7), (16, 97.7), (17, 95.7), (18, 96.3), (19, 96.3)
### Key Observations
* The model generally performs well (high accuracy) across all types and lengths.
* Type '>' shows the most significant variation in accuracy with increasing length, exhibiting a dip in performance around length 4 before recovering.
* Type 'o' consistently demonstrates the highest accuracy across all lengths.
* Type 'm' and 'n' show very stable and high accuracy.
* There is a general trend of accuracy being higher for shorter lengths (0-5) for most types, with some types showing improvement at longer lengths.
### Interpretation
The heatmap demonstrates the generalization capability of the Qwen-2.5 1.5B model on the MIND dataset. The consistent high accuracy across most types suggests the model is robust. The variation observed in Type '>' might indicate sensitivity to specific patterns or structures present in those examples, particularly at intermediate lengths. The consistently high performance of Type 'o' could suggest that this type is easier for the model to process or represents a more common pattern in the training data. The overall trend suggests that the model's performance is relatively stable with increasing length, but some types benefit from longer context windows while others do not. This information is valuable for understanding the model's strengths and weaknesses and for optimizing its performance on specific tasks. The heatmap provides a visual representation of the model's performance profile, allowing for quick identification of areas where further investigation or improvement may be needed.