## Heatmap: MIND - Core Generalization - Qwen-2.5 1.5B
### Overview
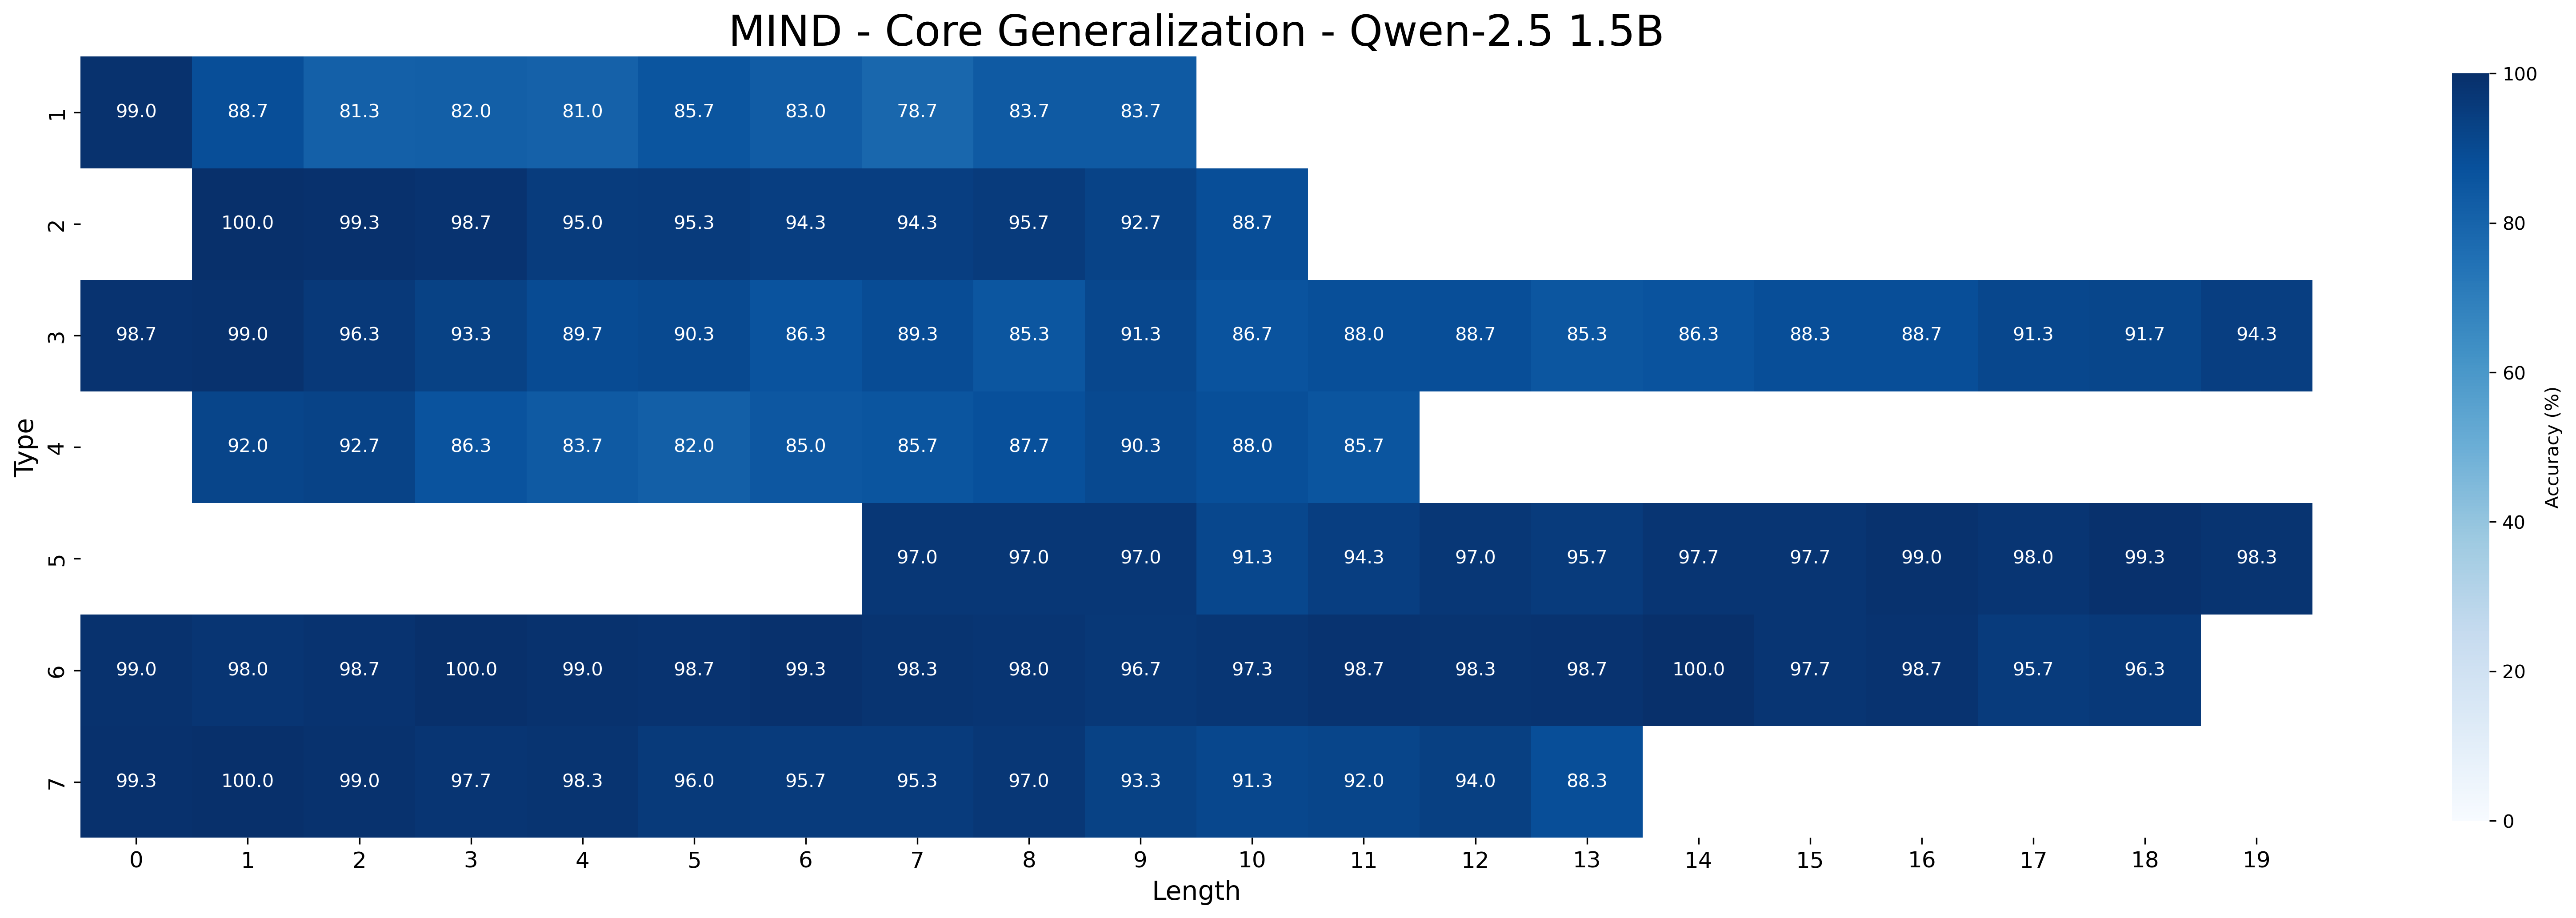
This image is a heatmap visualizing the accuracy performance of the "Qwen-2.5 1.5B" model on a task or benchmark named "MIND - Core Generalization." The chart plots performance across two dimensions: "Type" (y-axis) and "Length" (x-axis). The color intensity represents accuracy percentage, with a corresponding color bar legend on the right.
### Components/Axes
* **Title:** "MIND - Core Generalization - Qwen-2.5 1.5B" (centered at the top).
* **Y-Axis (Vertical):** Labeled "Type". It contains 7 discrete categories, numbered 1 through 7 from top to bottom.
* **X-Axis (Horizontal):** Labeled "Length". It contains 20 discrete categories, numbered 0 through 19 from left to right.
* **Color Bar Legend:** Located on the far right of the chart. It is a vertical gradient bar labeled "Accuracy (%)".
* Scale: 0 (bottom, lightest blue/white) to 100 (top, darkest blue).
* Major tick marks are at 0, 20, 40, 60, 80, and 100.
* **Data Grid:** The main body of the chart is a grid of colored cells. Each cell corresponds to a specific (Type, Length) pair. The numerical accuracy value is printed in white text within each cell. Cells with no data are left blank (white).
### Detailed Analysis
The following table reconstructs the data from the heatmap. "N/A" indicates a blank cell with no reported data.
| Type \ Length | 0 | 1 | 2 | 3 | 4 | 5 | 6 | 7 | 8 | 9 | 10 | 11 | 12 | 13 | 14 | 15 | 16 | 17 | 18 | 19 |
| :--- | :--- | :--- | :--- | :--- | :--- | :--- | :--- | :--- | :--- | :--- | :--- | :--- | :--- | :--- | :--- | :--- | :--- | :--- | :--- | :--- |
| **1** | 99.0 | 88.7 | 81.3 | 82.0 | 81.0 | 85.7 | 83.0 | 78.7 | 83.7 | 83.7 | N/A | N/A | N/A | N/A | N/A | N/A | N/A | N/A | N/A | N/A |
| **2** | N/A | 100.0 | 99.3 | 98.7 | 95.0 | 95.3 | 94.3 | 94.3 | 95.7 | 92.7 | 88.7 | N/A | N/A | N/A | N/A | N/A | N/A | N/A | N/A | N/A |
| **3** | 98.7 | 99.0 | 96.3 | 93.3 | 89.7 | 90.3 | 86.3 | 89.3 | 85.3 | 91.3 | 86.7 | 88.0 | 88.7 | 85.3 | 86.3 | 88.3 | 88.7 | 91.3 | 91.7 | 94.3 |
| **4** | N/A | 92.0 | 92.7 | 86.3 | 83.7 | 82.0 | 85.0 | 85.7 | 87.7 | 90.3 | 88.0 | 85.7 | N/A | N/A | N/A | N/A | N/A | N/A | N/A | N/A |
| **5** | N/A | N/A | N/A | N/A | N/A | N/A | N/A | 97.0 | 97.0 | 97.0 | 91.3 | 94.3 | 97.0 | 95.7 | 97.7 | 97.7 | 99.0 | 98.0 | 99.3 | 98.3 |
| **6** | 99.0 | 98.0 | 98.7 | 100.0 | 99.0 | 98.7 | 99.3 | 98.3 | 98.0 | 96.7 | 97.3 | 98.7 | 98.3 | 98.7 | 100.0 | 97.7 | 98.7 | 95.7 | 96.3 | N/A |
| **7** | 99.3 | 100.0 | 99.0 | 97.7 | 98.3 | 96.0 | 95.7 | 95.3 | 97.0 | 93.3 | 91.3 | 92.0 | 94.0 | 88.3 | N/A | N/A | N/A | N/A | N/A | N/A |
### Key Observations
1. **Performance Range:** Accuracy values range from a low of **78.7%** (Type 1, Length 7) to a high of **100.0%** (achieved multiple times, e.g., Type 2 Length 1, Type 6 Lengths 3 & 14, Type 7 Length 1).
2. **Data Coverage:** Not all (Type, Length) combinations have data.
* **Type 1** has data only for Lengths 0-9.
* **Type 2** has data only for Lengths 1-10.
* **Type 4** has data only for Lengths 1-11.
* **Type 5** has data only for Lengths 7-19.
* **Type 7** has data only for Lengths 0-13.
* **Types 3 and 6** have the most complete coverage, with data for almost all lengths (Type 3: 0-19, Type 6: 0-18).
3. **Trends by Type:**
* **Type 1:** Shows a general downward trend from 99.0% at Length 0 to the low 80s/high 70s for longer lengths.
* **Type 2:** Starts at 100% and shows a gradual decline to 88.7% at Length 10.
* **Type 3:** Performance fluctuates but remains relatively stable in the high 80s to low 90s across all lengths.
* **Type 4:** Performance is in the 80s and low 90s, with a slight dip in the middle lengths.
* **Type 5:** Exhibits very high and stable performance, consistently above 91% and often above 97% for the lengths where data exists.
* **Type 6:** Shows exceptionally high and stable performance, with most values between 96% and 100%.
* **Type 7:** Starts very high (99-100%) and shows a gradual decline as length increases, dropping to 88.3% at Length 13.
4. **Spatial Pattern:** The heatmap is not a full rectangle. The missing data creates a stepped pattern, suggesting that certain "Types" are only evaluated or applicable for specific ranges of "Length."
### Interpretation
This heatmap provides a granular view of the Qwen-2.5 1.5B model's generalization capabilities on the MIND benchmark. The "Type" axis likely represents different categories or difficulty levels of tasks, while "Length" probably corresponds to sequence length, complexity, or number of steps.
* **Core Finding:** The model demonstrates strong overall performance, with most accuracy values above 85%. It achieves perfect scores (100%) on several task-length combinations.
* **Generalization Strength:** **Types 5 and 6** represent areas of exceptional strength, where the model maintains near-perfect accuracy regardless of length. This suggests robust generalization for these task categories.
* **Performance Degradation:** **Types 1, 2, and 7** show a clearer pattern of performance degradation as length increases. This indicates a potential limitation in handling longer or more complex instances within these specific task types.
* **Stability vs. Variability:** **Type 3** is notable for its stability across the entire length spectrum (0-19), suggesting consistent, reliable performance for that category.
* **Data Gaps:** The missing cells are informative. They imply that the evaluation was not uniform; some task types were only tested on specific length ranges. This could be due to the inherent nature of the tasks (e.g., Type 5 tasks might not exist for short lengths) or a deliberate evaluation design.
In summary, the model exhibits high proficiency on the MIND benchmark, but its generalization is not uniform. Performance is highly dependent on the task "Type," with some categories showing remarkable robustness to increasing "Length" and others showing a measurable decline. This detailed breakdown is crucial for understanding the model's specific strengths and weaknesses.