# Technical Document: MIND - Core Generalization - Qwen-2.5 1.5B
## Image Description
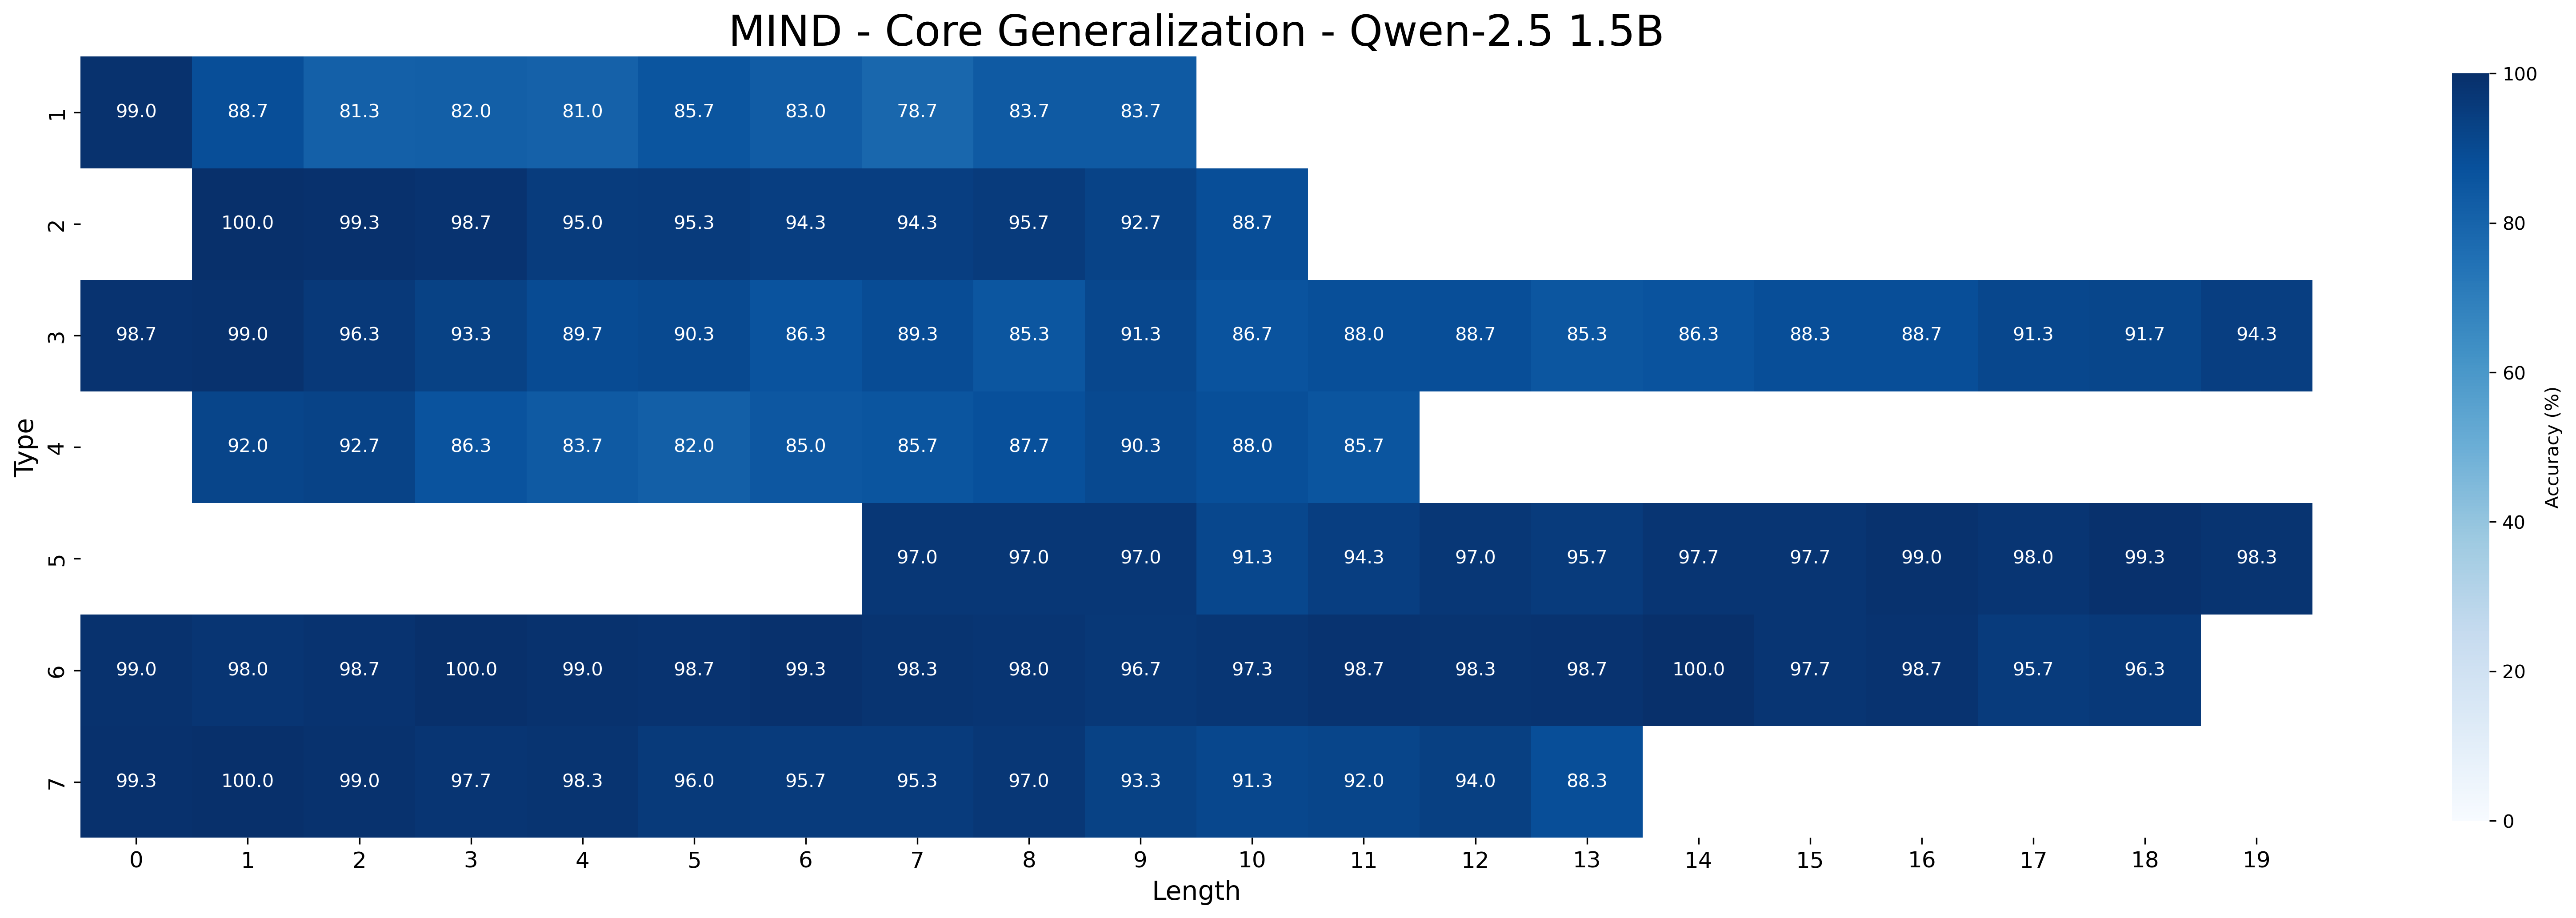
The image is a **heatmap** visualizing accuracy percentages across different **Length** (x-axis) and **Type** (y-axis) parameters for the Qwen-2.5 1.5B model. The color intensity represents accuracy, with darker blue indicating higher accuracy (closer to 100%).
---
## Key Components
### 1. **Title**
- **Text**: `MIND - Core Generalization - Qwen-2.5 1.5B`
### 2. **Axes**
- **X-axis (Length)**:
- Labels: `0` to `19` (integers)
- Title: `Length`
- **Y-axis (Type)**:
- Labels: `1` to `7` (integers)
- Title: `Type`
### 3. **Colorbar**
- **Title**: `Accuracy (%)`
- **Range**: `0%` (lightest) to `100%` (darkest)
- **Placement**: Right side of the heatmap
---
## Data Structure
The heatmap is a **7x20 grid** (7 rows for Type, 20 columns for Length). Each cell contains a numerical value representing accuracy percentage. Below is the reconstructed table:
| Type \ Length | 0 | 1 | 2 | 3 | 4 | 5 | 6 | 7 | 8 | 9 | 10 | 11 | 12 | 13 | 14 | 15 | 16 | 17 | 18 | 19 |
|---------------|------|------|------|------|------|------|------|------|------|------|------|------|------|------|------|------|------|------|------|------|
| 1 | 99.0 | 88.7 | 81.3 | 82.0 | 81.0 | 85.7 | 83.0 | 78.7 | 83.7 | 83.7 | | | | | | | | | | |
| 2 | | 100.0| 99.3 | 98.7 | 95.0 | 95.3 | 94.3 | 94.3 | 95.7 | 92.7 | 88.7 | | | | | | | | | |
| 3 | 98.7 | 99.0 | 96.3 | 93.3 | 89.7 | 90.3 | 86.3 | 89.3 | 85.3 | 91.3 | 86.7 | 88.0 | 88.7 | 85.3 | 86.3 | 88.3 | 88.7 | 91.3 | 91.7 | 94.3 |
| 4 | | 92.0 | 92.7 | 86.3 | 83.7 | 82.0 | 85.0 | 85.7 | 87.7 | 90.3 | 88.0 | 85.7 | | | | | | | | |
| 5 | | | | | | | | 97.0 | 97.0 | 97.0 | 91.3 | 94.3 | 97.0 | 95.7 | 97.7 | 97.7 | 99.0 | 98.0 | 99.3 | 98.3 |
| 6 | 99.0 | 98.0 | 98.7 | 100.0| 99.0 | 98.7 | 99.3 | 98.3 | 98.0 | 96.7 | 97.3 | 98.7 | 98.3 | 98.7 | 100.0| 97.7 | 98.7 | 95.7 | 96.3 | |
| 7 | 99.3 | 100.0| 99.0 | 97.7 | 98.3 | 96.0 | 95.7 | 95.3 | 97.0 | 93.3 | 91.3 | 92.0 | 94.0 | 88.3 | | | | | | |
---
## Trends and Observations
1. **General Trend**:
- Accuracy **decreases** as `Length` increases for most `Type` values (e.g., Type 1 drops from 99.0% at Length 0 to 78.7% at Length 7).
- Exceptions: Type 7 maintains high accuracy (e.g., 100.0% at Length 1, 99.3% at Length 19).
2. **High-Performing Types**:
- **Type 2**: Peaks at 100.0% (Length 1), remains above 88.7% until Length 10.
- **Type 3**: Consistently above 85.3% across all lengths.
- **Type 6**: Maintains near-perfect accuracy (98.0–100.0%) until Length 16.
3. **Low-Performing Regions**:
- Type 1 and 4 show significant drops below 80% for Lengths ≥ 7.
- Type 7’s accuracy plummets to 88.3% at Length 13.
---
## Spatial Grounding
- **Legend (Colorbar)**: Right-aligned, spans the full height of the heatmap.
- **Data Point Verification**:
- Darkest cells (e.g., Type 2, Length 1: 100.0%) match the 100% end of the colorbar.
- Lightest cells (e.g., Type 1, Length 7: 78.7%) align with the 80% range.
---
## Language and Text
- **Primary Language**: English
- **No additional languages detected**.
---
## Final Notes
- The heatmap emphasizes trade-offs between model performance (accuracy) and input length/type complexity.
- Type 7 demonstrates robustness across lengths but shows a sharp decline at Length 13.
- Type 6 achieves near-perfect accuracy for shorter lengths but degrades at longer inputs.