\n
## Bar Chart: E-CARE: Avg. Ratio of Hedge Cues
### Overview
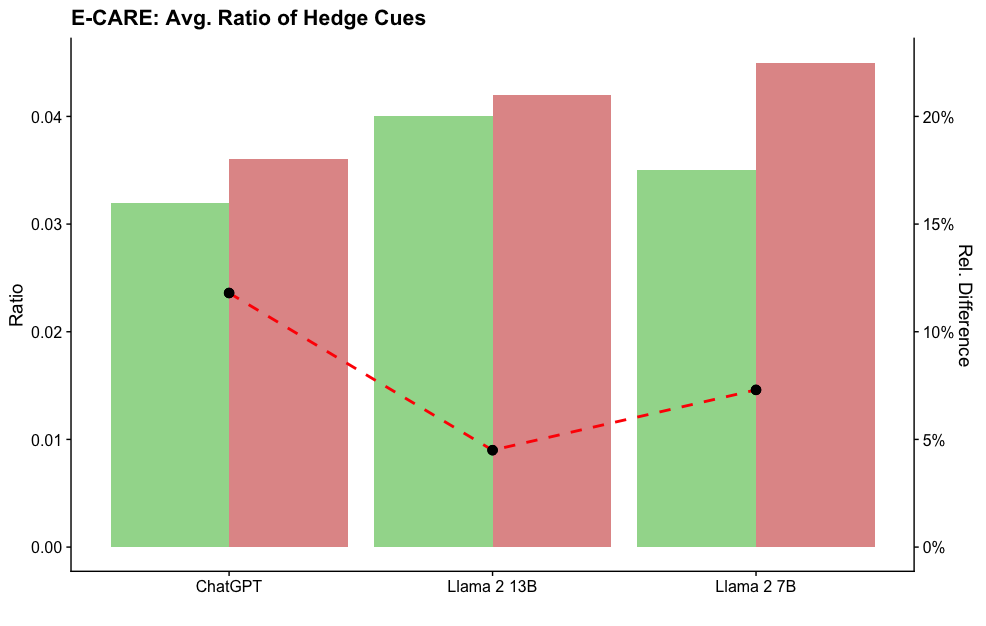
This bar chart compares the average ratio of hedge cues across three large language models: ChatGPT, Llama 2 13B, and Llama 2 7B. A secondary y-axis displays the relative difference. A dashed line connects data points representing the relative difference between models.
### Components/Axes
* **Title:** E-CARE: Avg. Ratio of Hedge Cues (top-center)
* **X-axis:** Model Name (ChatGPT, Llama 2 13B, Llama 2 7B)
* **Y-axis (left):** Ratio (scale from 0.00 to 0.04, increments of 0.01)
* **Y-axis (right):** Rel. Difference (scale from 0% to 20%, increments of 5%)
* **Bars:** Green bars represent the average ratio of hedge cues for each model. Red shading within the green bars indicates a secondary value.
* **Dashed Line:** Red dashed line connects the relative difference data points.
* **Data Points:** Black circular markers are placed on the dashed line, indicating the relative difference for each model comparison.
### Detailed Analysis
* **ChatGPT:** The green bar has a height of approximately 0.033. The red shading within the bar reaches approximately 0.038. The corresponding relative difference is approximately 12%.
* **Llama 2 13B:** The green bar has a height of approximately 0.041. The red shading within the bar reaches approximately 0.044. The corresponding relative difference is approximately 6%.
* **Llama 2 7B:** The green bar has a height of approximately 0.035. The red shading within the bar reaches approximately 0.046. The corresponding relative difference is approximately 9%.
The dashed line starts at approximately 12% for ChatGPT, decreases to approximately 6% for Llama 2 13B, and then increases to approximately 9% for Llama 2 7B.
### Key Observations
* Llama 2 13B exhibits the highest average ratio of hedge cues (approximately 0.041).
* ChatGPT has the lowest relative difference (approximately 12%).
* The relative difference between ChatGPT and Llama 2 13B is the largest.
* The red shading within the bars consistently exceeds the height of the green bars, suggesting a difference between two measured values.
### Interpretation
The chart suggests that Llama 2 13B utilizes hedge cues more frequently than ChatGPT and Llama 2 7B. The relative difference line indicates that the change in hedge cue usage between models is not linear. The consistent difference between the green bar height and the red shading suggests that there are two different measurements being compared, potentially representing different methods for calculating the hedge cue ratio or different datasets used for evaluation. The use of hedge cues could indicate a model's uncertainty or attempt to mitigate potential risks associated with its responses. The higher ratio in Llama 2 13B might suggest a more cautious or nuanced approach to generating text. Further investigation is needed to understand the specific meaning of the red shading and the context of the "E-CARE" metric.