\n
## Bar Chart with Line Overlay: E-CARE: Avg. Ratio of Hedge Cues
### Overview
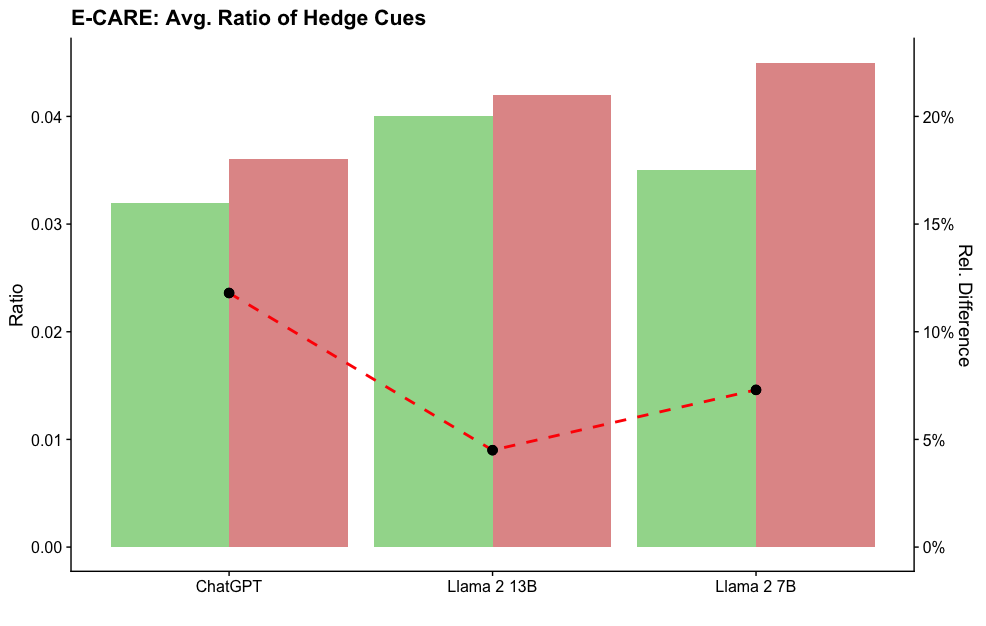
This is a dual-axis combination chart comparing the average ratio of "Hedge Cues" across three large language models: ChatGPT, Llama 2 13B, and Llama 2 7B. The chart uses grouped bars to display two distinct ratios for each model and a dashed line to show the relative difference between them.
### Components/Axes
* **Title:** "E-CARE: Avg. Ratio of Hedge Cues" (Top-left, bold).
* **X-Axis (Categorical):** Lists three models: "ChatGPT", "Llama 2 13B", "Llama 2 7B".
* **Primary Y-Axis (Left):** Labeled "Ratio". Scale ranges from 0.00 to 0.04, with major ticks at 0.00, 0.01, 0.02, 0.03, and 0.04.
* **Secondary Y-Axis (Right):** Labeled "Rel. Difference". Scale is in percentages, ranging from 0% to 20%, with major ticks at 0%, 5%, 10%, 15%, and 20%.
* **Data Series (Bars):** Two bars per model.
* **Green Bar (Left bar in each group):** Represents one category of hedge cue ratio (e.g., perhaps "Hedge Cues" or a specific type).
* **Red Bar (Right bar in each group):** Represents a second, contrasting category of hedge cue ratio (e.g., perhaps "Non-Hedge Cues" or a different type).
* *Note: The specific legend defining the green and red categories is not present within the chart area.*
* **Data Series (Line):** A red dashed line with black circular markers at each data point, plotted against the right "Rel. Difference" axis.
### Detailed Analysis
**Bar Data (Approximate Values from Left "Ratio" Axis):**
1. **ChatGPT:**
* Green Bar: ~0.032
* Red Bar: ~0.036
2. **Llama 2 13B:**
* Green Bar: ~0.040
* Red Bar: ~0.042
3. **Llama 2 7B:**
* Green Bar: ~0.035
* Red Bar: ~0.045
**Line Data (Approximate Values from Right "Rel. Difference" Axis):**
* The red dashed line connects three black data points.
* **Point 1 (Above ChatGPT):** ~12%
* **Point 2 (Above Llama 2 13B):** ~5%
* **Point 3 (Above Llama 2 7B):** ~7%
**Trend Verification:**
* **Green Bar Trend:** The ratio increases from ChatGPT (~0.032) to Llama 2 13B (~0.040), then decreases for Llama 2 7B (~0.035).
* **Red Bar Trend:** The ratio shows a steady increase from ChatGPT (~0.036) to Llama 2 13B (~0.042) to Llama 2 7B (~0.045).
* **Line Trend (Rel. Difference):** The relative difference starts at ~12% for ChatGPT, drops sharply to its lowest point at ~5% for Llama 2 13B, and then rises slightly to ~7% for Llama 2 7B.
### Key Observations
1. For all three models, the value represented by the red bar is higher than that of the green bar.
2. The smallest gap between the green and red bars (and thus the lowest relative difference, ~5%) occurs for the Llama 2 13B model.
3. The largest gap between the bars, and the highest relative difference (~12%), is observed for ChatGPT.
4. The Llama 2 7B model exhibits the highest absolute value on the chart (red bar at ~0.045) and a moderate relative difference (~7%).
### Interpretation
The chart suggests a comparative analysis of linguistic "hedging" behavior (e.g., using words like "might," "possibly," "could") in model outputs, likely from the E-CARE evaluation framework. The two bar colors probably represent two different conditions, datasets, or definitions of hedge cues being compared.
The data indicates that the Llama 2 13B model has the most balanced output between the two measured categories (smallest relative difference), while ChatGPT's outputs show the greatest disparity. The Llama 2 7B model produces the highest measured ratio for the "red" category but maintains a moderate difference from its "green" category value.
The key takeaway is that model size (13B vs. 7B) and architecture (Llama vs. ChatGPT's underlying model) significantly influence the frequency and balance of hedging language, with implications for model safety, calibration, and communication style. The absence of a legend within the chart is a critical limitation, as the precise meaning of the green and red bars is essential for a full technical understanding.