## Bar Chart: E-CARE: Avg. Ratio of Hedge Cues
### Overview
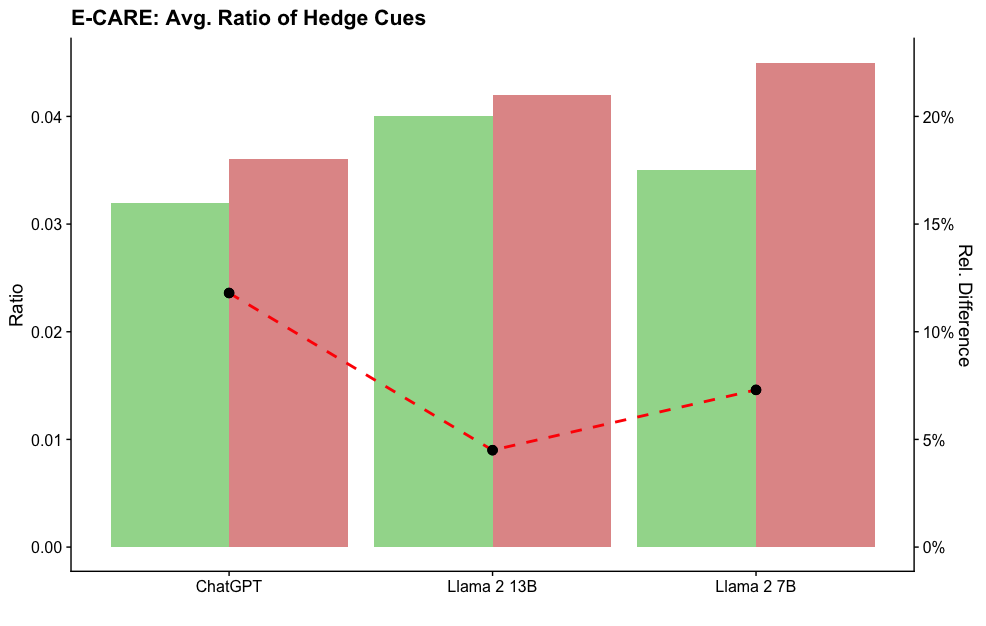
The chart compares the average ratio of hedge cues across three language models (ChatGPT, Llama 2 13B, Llama 2 7B) using grouped bars. A red dashed line overlays the chart to show relative differences between models, with percentages labeled above each data point.
### Components/Axes
- **X-axis**: Model names (ChatGPT, Llama 2 13B, Llama 2 7B), evenly spaced.
- **Y-axis (left)**: "Ratio" (0.00 to 0.04), linear scale.
- **Legend**:
- Green bars: "Hedge Cues" (ratio values).
- Red bars: "Relative Difference" (percentage values).
- **Red dashed line**: Connects data points for relative differences, with labels at ~12%, ~5%, and ~15% for each model.
### Detailed Analysis
1. **ChatGPT**:
- Green bar (Hedge Cues): ~0.032.
- Red bar (Relative Difference): ~12%.
2. **Llama 2 13B**:
- Green bar (Hedge Cues): ~0.040.
- Red bar (Relative Difference): ~5%.
3. **Llama 2 7B**:
- Green bar (Hedge Cues): ~0.035.
- Red bar (Relative Difference): ~22%.
### Key Observations
- Llama 2 7B has the highest relative difference (~22%) compared to other models.
- Llama 2 13B has the highest hedge cue ratio (~0.040) but the lowest relative difference (~5%).
- ChatGPT shows moderate hedge cue usage (~0.032) with a mid-range relative difference (~12%).
### Interpretation
The data suggests that larger models (e.g., Llama 2 7B) exhibit higher relative differences in hedge cue usage compared to smaller models (e.g., Llama 2 13B). However, the absolute hedge cue ratio peaks at Llama 2 13B, indicating that model size does not linearly correlate with hedge cue frequency. The red dashed line highlights that relative differences are most pronounced in the Llama 2 7B model, potentially due to architectural differences or training data biases. This could imply that smaller models (like Llama 2 13B) are more consistent in their hedge cue usage, while larger models (Llama 2 7B) show greater variability.