# Technical Document Extraction: Control Value Over Time
## Graph Title
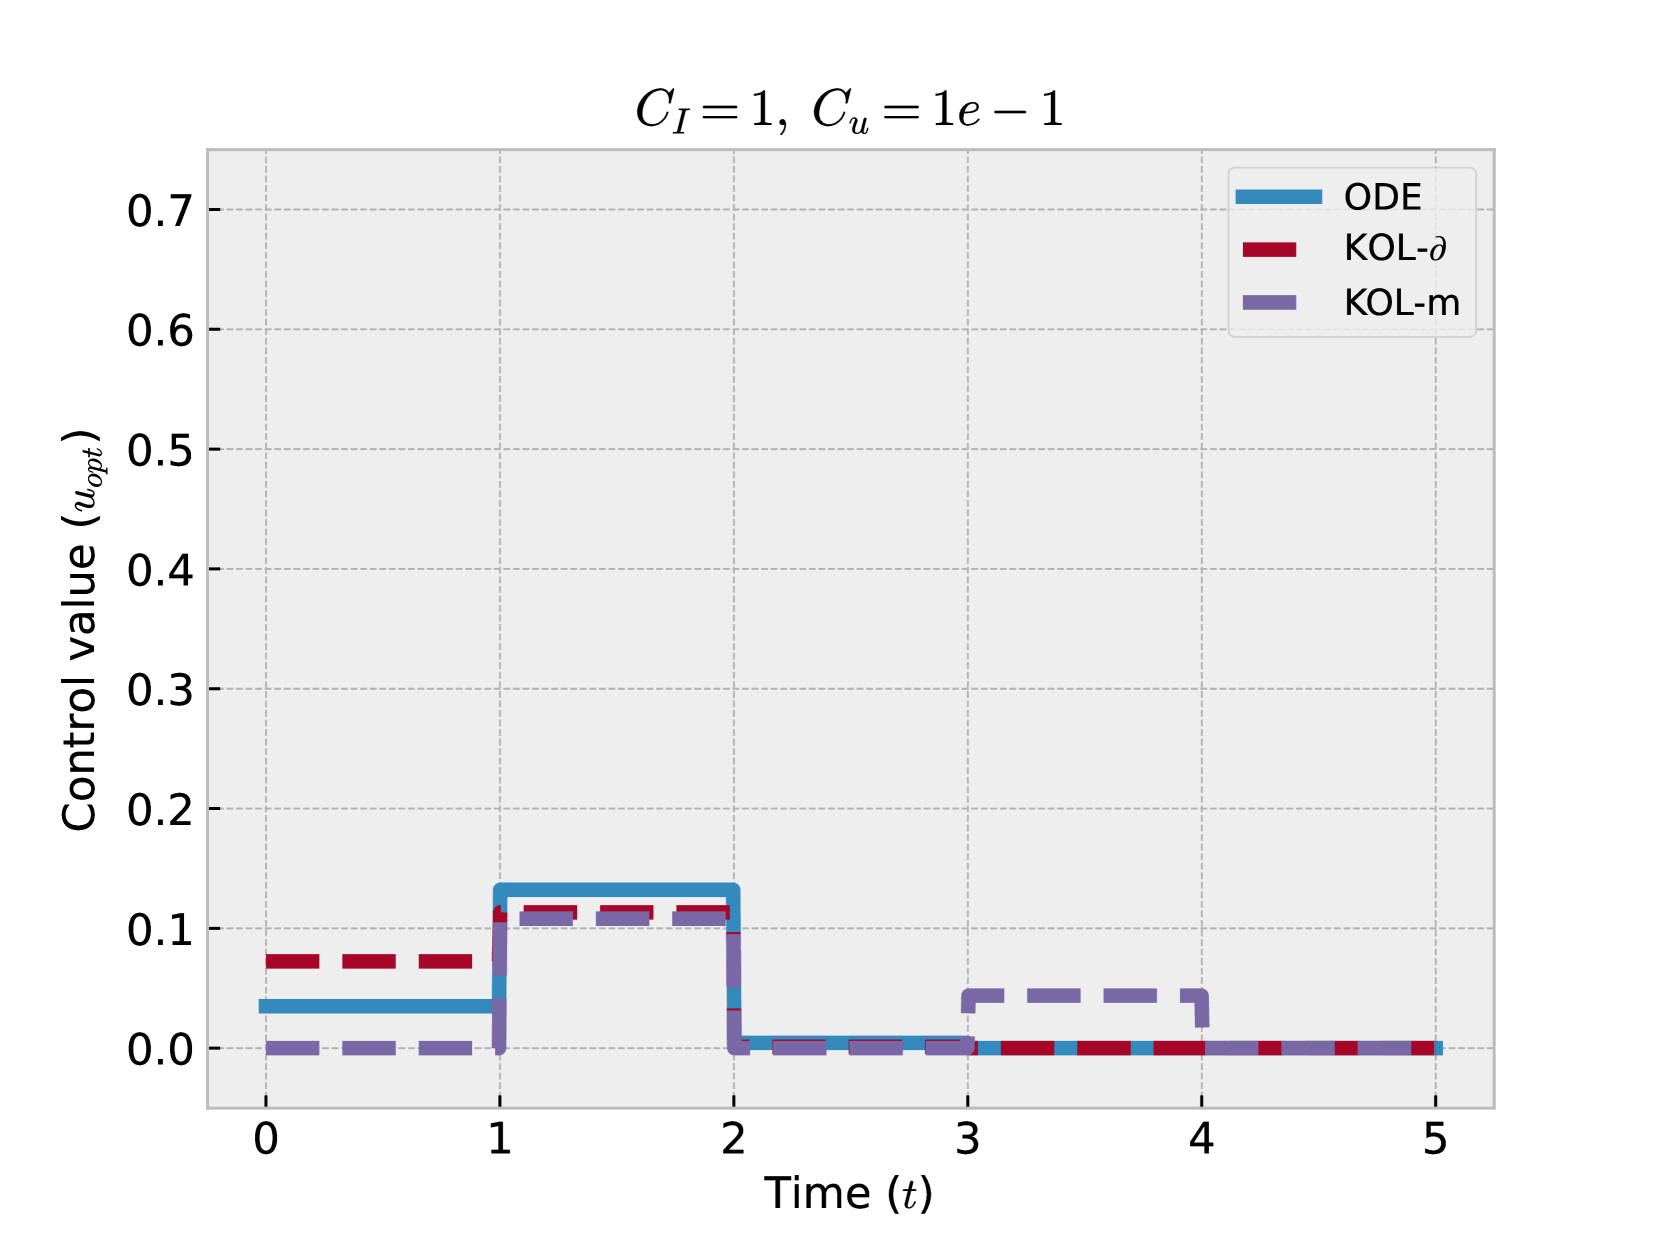
**C_I = 1, C_u = 1e-1**
## Axes Labels
- **X-axis**: Time (t)
- Range: 0 to 5
- Tick marks: 0, 1, 2, 3, 4, 5
- **Y-axis**: Control value (u_opt)
- Range: 0 to 0.7
- Tick marks: 0, 0.1, 0.2, 0.3, 0.4, 0.5, 0.6, 0.7
## Legend
- **ODE**: Blue line
- **KOL-δ**: Red line
- **KOL-m**: Purple line
## Key Trends and Data Points
1. **ODE (Blue Line)**
- **t = 0**: Starts at 0.
- **t = 1**: Jumps to ~0.1.
- **t = 1–2**: Maintains ~0.1.
- **t = 2**: Drops to 0.
- **t = 2–5**: Remains at 0.
2. **KOL-δ (Red Line)**
- **t = 0**: Starts at ~0.05.
- **t = 1**: Increases to ~0.1.
- **t = 1–2**: Maintains ~0.1.
- **t = 2**: Drops to 0.
- **t = 2–5**: Remains at 0.
3. **KOL-m (Purple Line)**
- **t = 0**: Starts at 0.
- **t = 1**: Rises to ~0.05.
- **t = 1–2**: Maintains ~0.05.
- **t = 2**: Drops to 0.
- **t = 3.5**: Brief peak to ~0.05.
- **t = 3.5–5**: Returns to 0.
## Observations
- All control strategies exhibit a **step-like behavior** with activation at **t = 1** and deactivation at **t = 2**.
- **ODE** achieves the highest control value (~0.1) during its active phase.
- **KOL-δ** and **KOL-m** show lower control values (~0.05–0.1) during activation.
- **KOL-m** uniquely exhibits a secondary transient peak at **t = 3.5**.
- All strategies return to 0 by **t = 5**.
## Notes
- The graph uses dashed lines for all control strategies.
- Numerical values in the title (**C_I = 1**, **C_u = 1e-1**) are critical parameters for the system.
- No overlapping data points between strategies after **t = 2**.