## Histogram: Number of Definitions and Theorems Across Samples
### Overview
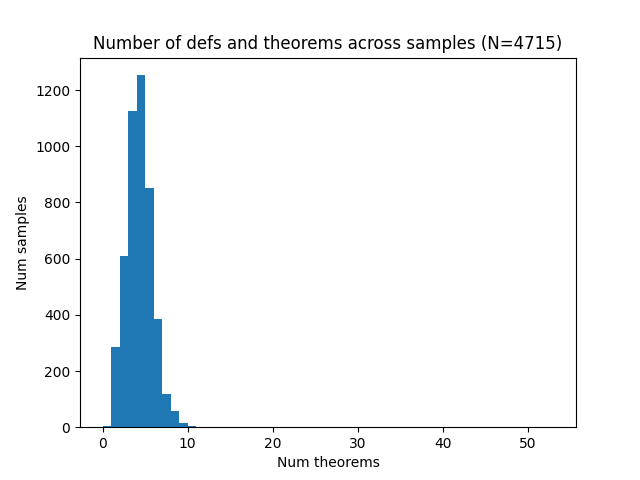
The image is a histogram showing the distribution of the number of definitions and theorems across a set of 4715 samples. The x-axis represents the number of theorems, and the y-axis represents the number of samples. The histogram shows a right-skewed distribution, with most samples having a small number of theorems.
### Components/Axes
* **Title:** Number of defs and theorems across samples (N=4715)
* **X-axis:** Num theorems
* Scale: 0 to 50, with tick marks at intervals of 10 (0, 10, 20, 30, 40, 50)
* **Y-axis:** Num samples
* Scale: 0 to 1200, with tick marks at intervals of 200 (0, 200, 400, 600, 800, 1000, 1200)
* **Data:** The data is represented by blue bars.
### Detailed Analysis
The histogram's bars show the frequency of samples for each number of theorems.
* The highest bar is located at approximately x=5, with a value of approximately y=1250.
* The distribution is heavily skewed to the right, indicating that most samples have a small number of theorems.
* The frequency decreases rapidly as the number of theorems increases.
* The bar at x=0 has a value of approximately y=20.
* The bar at x=1 has a value of approximately y=280.
* The bar at x=2 has a value of approximately y=600.
* The bar at x=3 has a value of approximately y=850.
* The bar at x=4 has a value of approximately y=1120.
* The bar at x=6 has a value of approximately y=620.
* The bar at x=7 has a value of approximately y=300.
* The bar at x=8 has a value of approximately y=100.
* The bar at x=9 has a value of approximately y=60.
* The bar at x=10 has a value of approximately y=20.
### Key Observations
* The distribution is strongly right-skewed.
* The majority of samples have a small number of theorems (less than 10).
* The peak of the distribution is around 5 theorems.
### Interpretation
The histogram suggests that, across the 4715 samples, the number of definitions and theorems is generally low. The right skew indicates that while most samples have few theorems, there are some samples with a significantly higher number of theorems, pulling the tail of the distribution to the right. This could indicate that some samples are inherently more complex or cover more material than others. The concentration of samples around 5 theorems suggests a typical or common level of complexity within the dataset.