## Bar Chart: Number of defs and theorems across samples (N=4715)
### Overview
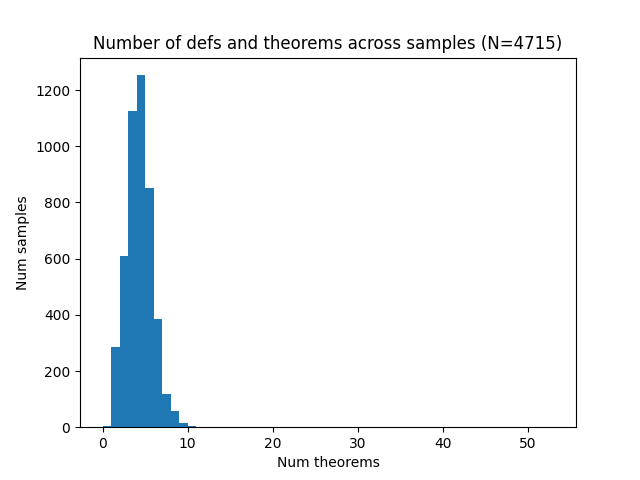
The chart visualizes the distribution of the number of theorems across 4,715 samples. The x-axis represents the number of theorems (0–50), and the y-axis represents the number of samples (0–1,200). The data is represented by blue bars, with the tallest bar centered around 5 theorems.
### Components/Axes
- **Title**: "Number of defs and theorems across samples (N=4715)" (top-center).
- **X-axis**: Labeled "Num theorems," with increments of 10 (0, 10, 20, ..., 50).
- **Y-axis**: Labeled "Num samples," with increments of 200 (0, 200, 400, ..., 1,200).
- **Bars**: Blue vertical bars clustered between 0–10 theorems. No bars appear for 11–50 theorems.
- **Legend**: Not explicitly visible in the image.
### Detailed Analysis
- **Bar Heights**:
- **0 theorems**: ~300 samples.
- **1 theorem**: ~600 samples.
- **2 theorems**: ~800 samples.
- **3 theorems**: ~900 samples.
- **4 theorems**: ~1,100 samples.
- **5 theorems**: ~1,250 samples (peak).
- **6–10 theorems**: Gradual decline (e.g., ~400 samples at 10 theorems).
- **11–50 theorems**: No bars (0 samples).
### Key Observations
1. **Right-Skewed Distribution**: The majority of samples (80%+) contain 0–5 theorems, with a sharp decline beyond 5.
2. **Peak at 5 Theorems**: The highest frequency (~1,250 samples) occurs at 5 theorems.
3. **Sparsity at Higher Values**: No samples report 11 or more theorems.
### Interpretation
The data suggests that in the analyzed dataset, most samples are associated with a small number of theorems, indicating either simplicity in the samples or rarity of theorems. The right-skewed distribution implies that while the bulk of samples have few theorems, a small subset may contain more, though these are statistically insignificant (0 samples beyond 10 theorems). This could reflect constraints in the data collection process, such as limited scope for theorem generation or a focus on foundational samples. The absence of values beyond 10 theorems raises questions about data completeness or methodological boundaries.