## Diagram: Bipartite Graph with State-Transition Weights
### Overview
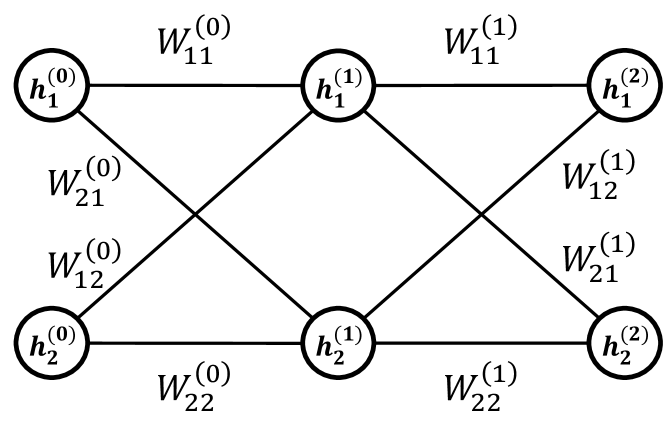
The image depicts a bipartite graph structure with two primary node sets (`h₁` and `h₂`) and three state layers (`^(0)`, `^(1)`, `^(2)`). Nodes are connected via weighted edges, suggesting a state-transition or dependency model.
### Components/Axes
- **Nodes**:
- Labeled `h₁^(0)`, `h₁^(1)`, `h₁^(2)` (left column) and `h₂^(0)`, `h₂^(1)`, `h₂^(2)` (right column).
- Subscript indices (`1`, `2`) distinguish node groups; superscripts (`^(0)`, `^(1)`, `^(2)`) denote states.
- **Edges**:
- Weighted connections between nodes, labeled with `W_ij^(k)`, where:
- `i`/`j` = source/target node group (`1` or `2`).
- `k` = state transition (`0` or `1`).
- Example: `W₁₁^(0)` connects `h₁^(0)` to `h₁^(1)`; `W₁₂^(0)` connects `h₁^(0)` to `h₂^(1)`.
### Detailed Analysis
- **Node Grouping**:
- `h₁` nodes form a vertical chain: `h₁^(0)` → `h₁^(1)` → `h₁^(2)`.
- `h₂` nodes mirror this structure: `h₂^(0)` → `h₂^(1)` → `h₂^(2)`.
- **Edge Weights**:
- **State 0 Transitions**:
- `W₁₁^(0)` (top-left), `W₁₂^(0)` (middle-left), `W₂₁^(0)` (middle-right), `W₂₂^(0)` (bottom-left).
- **State 1 Transitions**:
- `W₁₁^(1)` (top-right), `W₁₂^(1)` (middle-right), `W₂₁^(1)` (middle-left), `W₂₂^(1)` (bottom-right).
- **Spatial Layout**:
- Nodes are arranged in two vertical columns, with edges forming a crisscross pattern between columns.
### Key Observations
1. **Bipartite Structure**: Nodes alternate between `h₁` and `h₂` groups, with no intra-group connections except within the same state layer.
2. **State Progression**: Weights `^(0)` and `^(1)` suggest sequential transitions (e.g., `^(0)` → `^(1)`).
3. **Symmetry**: The graph exhibits mirrored connections between `h₁` and `h₂` groups (e.g., `W₁₂^(0)` and `W₂₁^(1)`).
### Interpretation
This diagram likely represents a **state-dependent bipartite system**, such as:
- A **neural network** with two hidden layers (`h₁`, `h₂`) and state-dependent weights.
- A **Markov chain** where transitions between states (`^(0)` → `^(1)`) are governed by weights.
- A **dependency graph** for a process with two components (`h₁`, `h₂`) and temporal or conditional states.
The weights (`W_ij^(k)`) quantify interactions between nodes, with state superscripts indicating dynamic or conditional relationships. The absence of self-loops or direct `h₁`→`h₁`/`h₂`→`h₂` connections emphasizes cross-group dependencies.
---
**Note**: No numerical values are provided for weights; the diagram focuses on structural relationships. If this is part of a larger system (e.g., a neural network), the weights would typically be learned parameters.