# Technical Document Extraction: Line Graph Analysis
## Image Description
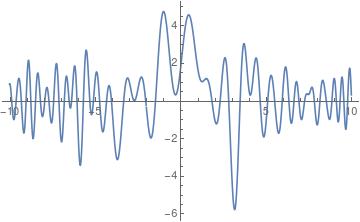
The image depicts a **line graph** with a **blue oscillating line** on a **white background**. The graph exhibits periodic fluctuations with varying amplitude and frequency. No textual elements (labels, legends, axis titles, or annotations) are present in the image.
---
## Key Observations
1. **Axes**:
- **X-axis**: Ranges from **-10 to 10** (integer increments).
- **Y-axis**: Ranges from **-6 to 4** (integer increments).
- No axis titles or labels are visible.
2. **Line Behavior**:
- The blue line oscillates with **multiple peaks and troughs**.
- **Amplitude**: Varies between approximately **-5.5 (minimum)** and **4.5 (maximum)**.
- **Frequency**: Approximately **10–12 full cycles** within the x-axis range (-10 to 10).
- **Notable Features**:
- A sharp trough near **x = -5** (y ≈ -5.5).
- A prominent peak near **x = 0** (y ≈ 4.5).
- Gradual damping of oscillations toward the right edge of the graph (x > 0).
3. **Data Trends**:
- The graph suggests a **nonlinear, periodic function** with potential damping (amplitude reduction over time).
- No clear pattern of symmetry or repetition is observed.
---
## Structural Analysis
- **Graph Type**: Line graph (single data series).
- **Line Color**: Blue.
- **Gridlines**: Present (horizontal and vertical, aligned with axis increments).
- **Absence of Metadata**:
- No legend, axis titles, or annotations.
- No data table or numerical labels on the line.
---
## Limitations
- Lack of textual context (e.g., axis labels, units, or function definitions) limits interpretability.
- No explicit indication of the mathematical model or real-world phenomenon represented.
---
## Conclusion
The graph visually represents a **damped oscillatory system** with no accompanying metadata. Further analysis would require additional context (e.g., axis labels, units, or function equations) to confirm the underlying model.