## Line Graph: Chance of Successful Edit Given ≥ n Failed Edits
### Overview
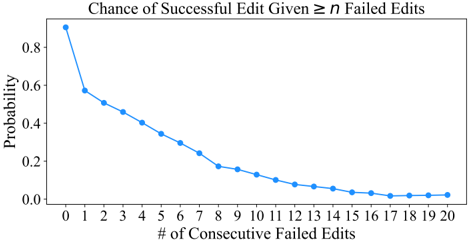
The image depicts a line graph illustrating the relationship between the number of consecutive failed edits and the probability of a successful edit. The y-axis represents probability (0.0 to 0.8), and the x-axis represents the number of consecutive failed edits (0 to 20). A single blue line with data points shows a declining trend, with probability decreasing as the number of failed edits increases.
### Components/Axes
- **Title**: "Chance of Successful Edit Given ≥ n Failed Edits"
- **Y-Axis**: Labeled "Probability" with a scale from 0.0 to 0.8 in increments of 0.2.
- **X-Axis**: Labeled "# of Consecutive Failed Edits" with integer markers from 0 to 20.
- **Legend**: Not explicitly visible in the image, but the line is blue, suggesting a single data series.
- **Data Points**: Blue dots connected by a line, plotted at each integer x-value.
### Detailed Analysis
- **X=0**: Probability ≈ 0.85 (highest point).
- **X=1**: Probability ≈ 0.6.
- **X=2**: Probability ≈ 0.5.
- **X=3**: Probability ≈ 0.45.
- **X=4**: Probability ≈ 0.4.
- **X=5**: Probability ≈ 0.35.
- **X=6**: Probability ≈ 0.3.
- **X=7**: Probability ≈ 0.25.
- **X=8**: Probability ≈ 0.2.
- **X=9**: Probability ≈ 0.15.
- **X=10**: Probability ≈ 0.1.
- **X=11**: Probability ≈ 0.08.
- **X=12**: Probability ≈ 0.06.
- **X=13**: Probability ≈ 0.05.
- **X=14**: Probability ≈ 0.04.
- **X=15**: Probability ≈ 0.03.
- **X=16**: Probability ≈ 0.02.
- **X=17–20**: Probability stabilizes near 0.01–0.02.
### Key Observations
1. **Rapid Initial Decline**: Probability drops sharply from ~0.85 (0 failed edits) to ~0.3 (6 failed edits).
2. **Gradual Stabilization**: After ~16 failed edits, the probability plateaus near 0.01–0.02, indicating minimal chance of success.
3. **Diminishing Returns**: Each additional failed edit reduces success probability less significantly as the number of failures increases.
### Interpretation
The data suggests that consecutive failed edits strongly correlate with reduced likelihood of success. The steep decline in early stages implies that initial failures have a disproportionate impact on outcomes. However, after ~16 failures, the probability stabilizes near zero, indicating a threshold where further failures have negligible effect. This could reflect user behavior (e.g., abandonment after repeated failures) or system constraints (e.g., technical limitations after prolonged errors). The trend underscores the importance of addressing failures early to maintain edit success rates.