## Line Chart: D8 L0 SR by Matrix Type
### Overview
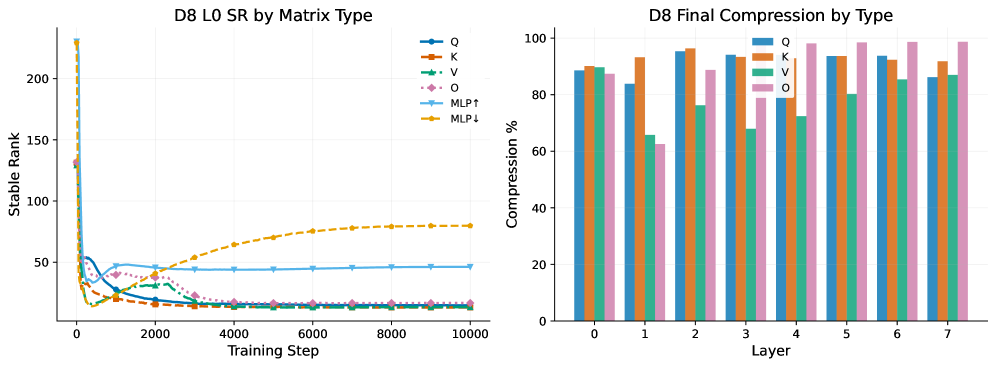
The left chart visualizes the evolution of "Stable Rank" across training steps for six matrix types (Q, K, V, O, MLP↑, MLP↓). Stable Rank is plotted on the y-axis (0–200), while training steps (0–10,000) are on the x-axis.
### Components/Axes
- **X-axis**: Training Step (0–10,000, linear scale).
- **Y-axis**: Stable Rank (0–200, linear scale).
- **Legend**:
- Q (blue line)
- K (orange line)
- V (green line)
- O (pink line)
- MLP↑ (light blue line)
- MLP↓ (yellow line)
### Detailed Analysis
- **Initial Drop**: All lines (Q, K, V, O, MLP↑, MLP↓) experience a sharp decline in Stable Rank within the first 1,000 training steps, dropping from ~200 to ~50.
- **Plateau Phase**: After the initial drop, Q, K, V, and O lines stabilize near 20–30 Stable Rank. MLP↑ remains flat at ~50.
- **MLP↓ Trend**: The yellow line (MLP↓) diverges, showing a gradual increase from ~50 to ~70 Stable Rank by 10,000 steps.
### Key Observations
- MLP↓ is the only matrix type with a rising Stable Rank trend post-initial drop.
- Q, K, V, and O lines converge to similar low Stable Rank values after training.
- MLP↑ maintains the highest Stable Rank (~50) throughout training.
### Interpretation
The chart suggests that MLP↓ adapts differently during training, potentially indicating unique optimization dynamics. The convergence of Q, K, V, and O implies shared stability mechanisms, while MLP↑’s persistent higher Stable Rank may reflect distinct architectural properties.
---
## Bar Chart: D8 Final Compression by Type
### Overview
The right chart compares compression efficiency (in %) across seven layers (0–7) for six matrix types (Q, K, V, O, MLP↑, MLP↓). Compression % is plotted on the y-axis (0–100), with layers on the x-axis.
### Components/Axes
- **X-axis**: Layer (0–7, categorical).
- **Y-axis**: Compression % (0–100, linear scale).
- **Legend**:
- Q (blue bars)
- K (orange bars)
- V (green bars)
- O (pink bars)
- MLP↑ (light blue bars)
- MLP↓ (yellow bars)
### Detailed Analysis
- **Layer 0**:
- Q (~90%), K (~90%), V (~85%), O (~80%), MLP↑ (~60%), MLP↓ (~50%).
- **Layer 1–3**:
- Q and K maintain ~85–90% compression.
- V and O drop to ~70–80%.
- MLP↑ and MLP↓ remain ~60–70%.
- **Layer 4–7**:
- Q and K stabilize at ~85–90%.
- V and O rise to ~80–90%.
- MLP↑ and MLP↓ improve to ~70–80%.
### Key Observations
- Q and K consistently achieve the highest compression across layers.
- MLP↓ shows the largest improvement in later layers (Layer 7: ~70%).
- MLP↑ underperforms in early layers but matches MLP↓ by Layer 7.
### Interpretation
Q and K’s superior compression suggests they are more amenable to efficient representation. MLP↓’s late-stage improvement may indicate layer-specific optimization opportunities. The divergence between MLP↑ and MLP↓ highlights potential trade-offs in compression strategies.
---
## Cross-Referenced Insights
- **Stable Rank vs. Compression**: Matrix types with lower Stable Rank (Q, K, V, O) generally achieve higher compression, suggesting a correlation between stability and compressibility.
- **MLP↓ Anomaly**: Despite lower initial Stable Rank, MLP↓’s compression improves significantly in later layers, warranting further investigation into its training dynamics.
- **MLP↑ Consistency**: MLP↑ maintains moderate Stable Rank and compression, indicating stable but suboptimal performance.