## Chart: Corrected vs. Original Wind Speed
### Overview
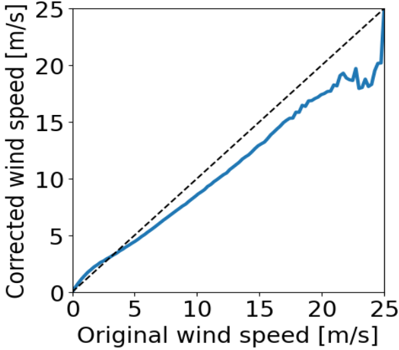
The image is a scatter plot comparing "Corrected wind speed" (y-axis) against "Original wind speed" (x-axis), both measured in meters per second (m/s). A dashed black line represents the ideal 1:1 relationship where corrected wind speed equals original wind speed. A blue line represents the actual relationship between the two.
### Components/Axes
* **X-axis:** "Original wind speed [m/s]". Scale ranges from 0 to 25, with tick marks at intervals of 5.
* **Y-axis:** "Corrected wind speed [m/s]". Scale ranges from 0 to 25, with tick marks at intervals of 5.
* **Dashed Black Line:** Represents the line where corrected wind speed equals original wind speed.
* **Solid Blue Line:** Represents the actual relationship between original and corrected wind speeds.
### Detailed Analysis
* **Dashed Black Line (Ideal):** This line starts at (0,0) and ends at (25,25), indicating a perfect 1:1 correlation between original and corrected wind speeds.
* **Solid Blue Line (Actual):**
* For original wind speeds between 0 and approximately 3 m/s, the corrected wind speed is lower than the original wind speed.
* From approximately 3 m/s to 23 m/s, the corrected wind speed is lower than the original wind speed, but the difference decreases as the original wind speed increases. The blue line slopes upward, but at a decreasing rate.
* Above approximately 23 m/s, the corrected wind speed increases sharply, exceeding the original wind speed. The line becomes erratic.
### Key Observations
* The corrected wind speed is generally lower than the original wind speed, except at very high original wind speeds (above 23 m/s).
* The relationship between original and corrected wind speeds is non-linear.
* There is a significant deviation from the ideal 1:1 relationship, especially at lower wind speeds.
* The corrected wind speed fluctuates significantly at high original wind speeds.
### Interpretation
The plot suggests that the "corrected" wind speed measurement process systematically underestimates wind speed for most values, especially at lower speeds. This underestimation is reduced as the original wind speed increases, until a point where the corrected wind speed overestimates the original. The erratic behavior at high wind speeds suggests potential instability or inaccuracies in the correction method at these levels. The data implies that the correction method is not a simple linear scaling and may involve a more complex algorithm or physical process. The deviation from the ideal line highlights the need for this correction, suggesting that the original wind speed measurements are not accurate and require adjustment.