## Scatter Plot: Corrected vs. Original Wind Speed
### Overview
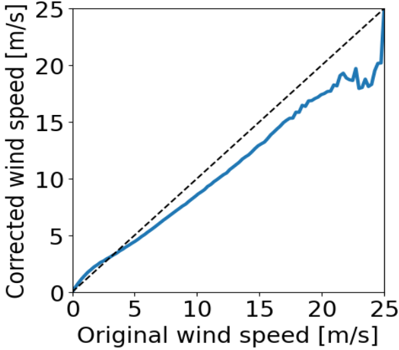
The image presents a scatter plot comparing original wind speed measurements against corrected wind speed measurements. A dashed black line representing a 1:1 relationship is also included for reference. The plot appears to show a non-linear relationship between the original and corrected wind speeds, with the corrected speeds generally lower than the original speeds at higher wind speeds.
### Components/Axes
* **X-axis:** Labeled "Original wind speed [m/s]", ranging from 0 to 25 m/s.
* **Y-axis:** Labeled "Corrected wind speed [m/s]", ranging from 0 to 25 m/s.
* **Data Series:** A single blue line representing the corrected wind speed as a function of the original wind speed.
* **Reference Line:** A dashed black line representing the identity line (y = x).
### Detailed Analysis
The blue line starts near the origin (0,0) and initially follows the dashed black line closely. As the original wind speed increases, the corrected wind speed begins to deviate below the dashed line.
Here's an approximate extraction of data points from the blue line:
* (0 m/s, 0 m/s)
* (1 m/s, 1.2 m/s)
* (2 m/s, 2.2 m/s)
* (3 m/s, 3.1 m/s)
* (4 m/s, 4.0 m/s)
* (5 m/s, 4.8 m/s)
* (6 m/s, 5.5 m/s)
* (7 m/s, 6.2 m/s)
* (8 m/s, 6.8 m/s)
* (9 m/s, 7.4 m/s)
* (10 m/s, 8.0 m/s)
* (11 m/s, 8.6 m/s)
* (12 m/s, 9.1 m/s)
* (13 m/s, 9.6 m/s)
* (14 m/s, 10.1 m/s)
* (15 m/s, 10.6 m/s)
* (16 m/s, 11.1 m/s)
* (17 m/s, 11.6 m/s)
* (18 m/s, 12.1 m/s)
* (19 m/s, 12.6 m/s)
* (20 m/s, 13.1 m/s)
* (21 m/s, 14.6 m/s)
* (22 m/s, 16.1 m/s)
* (23 m/s, 17.6 m/s)
* (24 m/s, 19.1 m/s)
* (25 m/s, 20.6 m/s)
The line plateaus around 20 m/s for the corrected wind speed, while the original wind speed continues to increase. There is some oscillation in the corrected wind speed between approximately 20 m/s and 25 m/s original wind speed.
### Key Observations
* The corrected wind speed is generally lower than the original wind speed, especially at higher wind speeds.
* The relationship between original and corrected wind speed is non-linear.
* There is a plateau in the corrected wind speed at higher original wind speeds.
* The corrected wind speed exhibits some variability at the highest original wind speeds.
### Interpretation
This plot likely represents a calibration or correction applied to wind speed measurements. The deviation from the 1:1 line suggests that the original wind speed measurements are systematically overestimated, and the correction aims to reduce this overestimation. The plateau in the corrected wind speed could indicate a maximum measurable or reportable wind speed by the corrected system. The oscillations at higher wind speeds might be due to sensor limitations or turbulence. The correction appears to be most effective at lower to moderate wind speeds, with diminishing returns at higher speeds. This could be due to the correction algorithm reaching its limits or the influence of other factors not accounted for in the correction. The data suggests a need for careful interpretation of wind speed measurements, particularly at higher speeds, and the importance of applying appropriate corrections.