## Histogram: Model Output Distributions
### Overview
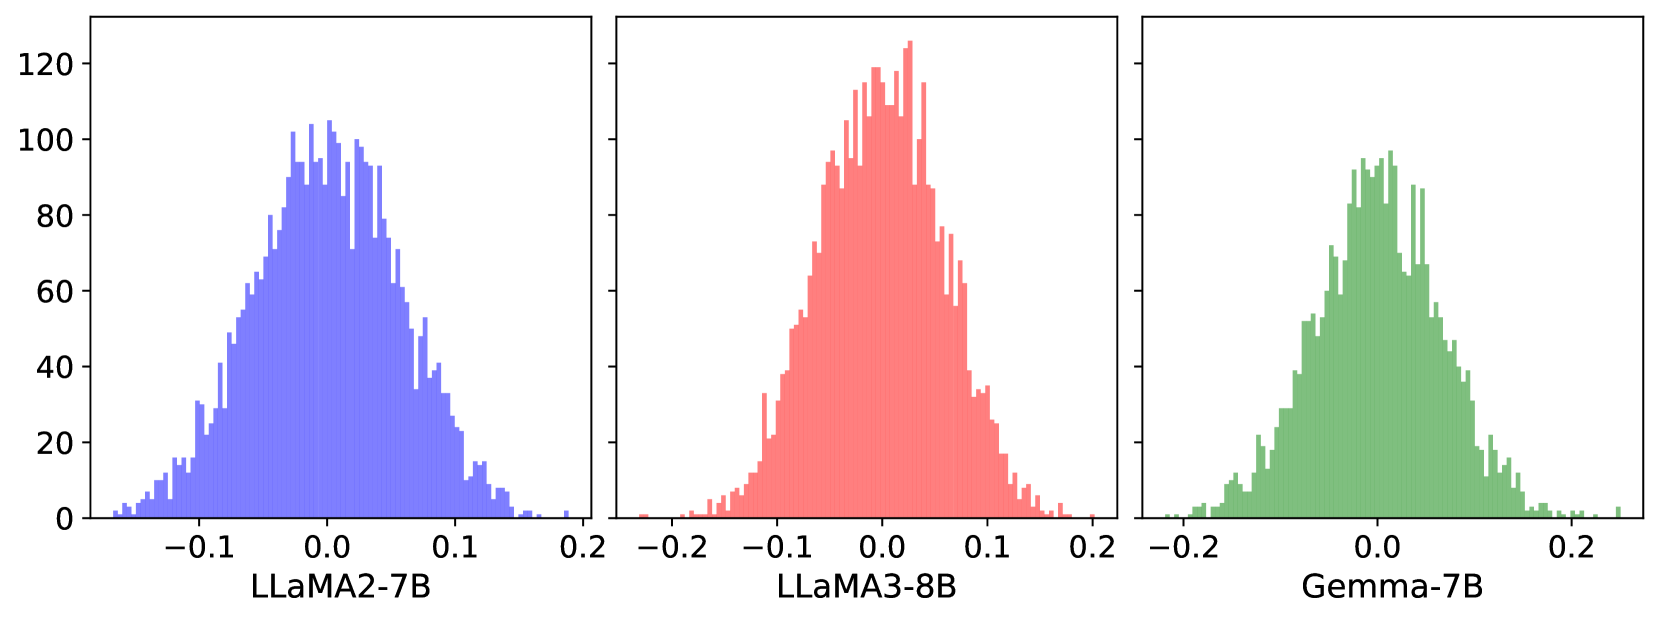
The image presents three histograms, each displaying the distribution of outputs for a different language model: LLaMA2-7B (blue), LLaMA3-8B (red), and Gemma-7B (green). The x-axis represents the output values, ranging from approximately -0.2 to 0.2, while the y-axis represents the frequency or count of each output value, ranging from 0 to 120.
### Components/Axes
* **X-axis:** Output Value, ranging from -0.2 to 0.2, with tick marks at -0.2, -0.1, 0.0, 0.1, and 0.2.
* **Y-axis:** Frequency/Count, ranging from 0 to 120, with tick marks at 0, 20, 40, 60, 80, 100, and 120.
* **Histograms:**
* **Left:** Blue histogram labeled "LLaMA2-7B".
* **Middle:** Red histogram labeled "LLaMA3-8B".
* **Right:** Green histogram labeled "Gemma-7B".
### Detailed Analysis
* **LLaMA2-7B (Blue):**
* The distribution is centered around 0.0.
* The frequency increases from -0.2 to approximately 0.0, reaching a peak around 0.0.
* The frequency decreases from 0.0 to 0.2.
* The maximum frequency is approximately 105.
* **LLaMA3-8B (Red):**
* The distribution is centered around 0.0.
* The frequency increases from -0.2 to approximately 0.0, reaching a peak around 0.0.
* The frequency decreases from 0.0 to 0.2.
* The maximum frequency is approximately 120.
* **Gemma-7B (Green):**
* The distribution is centered around 0.0.
* The frequency increases from -0.2 to approximately 0.0, reaching a peak around 0.0.
* The frequency decreases from 0.0 to 0.2.
* The maximum frequency is approximately 80.
### Key Observations
* All three distributions are unimodal and centered around 0.0.
* LLaMA3-8B (red) has the highest peak frequency, indicating a higher concentration of outputs around 0.0.
* Gemma-7B (green) has the lowest peak frequency, suggesting a wider spread of outputs compared to the other two models.
* LLaMA2-7B (blue) has a peak frequency between LLaMA3-8B and Gemma-7B.
### Interpretation
The histograms provide a visual comparison of the output distributions for three different language models. The fact that all three models have distributions centered around 0.0 suggests that their outputs tend to cluster around a central value. The differences in peak frequencies and spread indicate variations in the models' confidence or certainty in their outputs. LLaMA3-8B appears to be the most "confident" in its outputs, with a higher concentration around 0.0, while Gemma-7B exhibits a wider range of outputs, suggesting more variability or uncertainty. LLaMA2-7B falls in between these two extremes. These differences could be attributed to variations in model architecture, training data, or other factors.