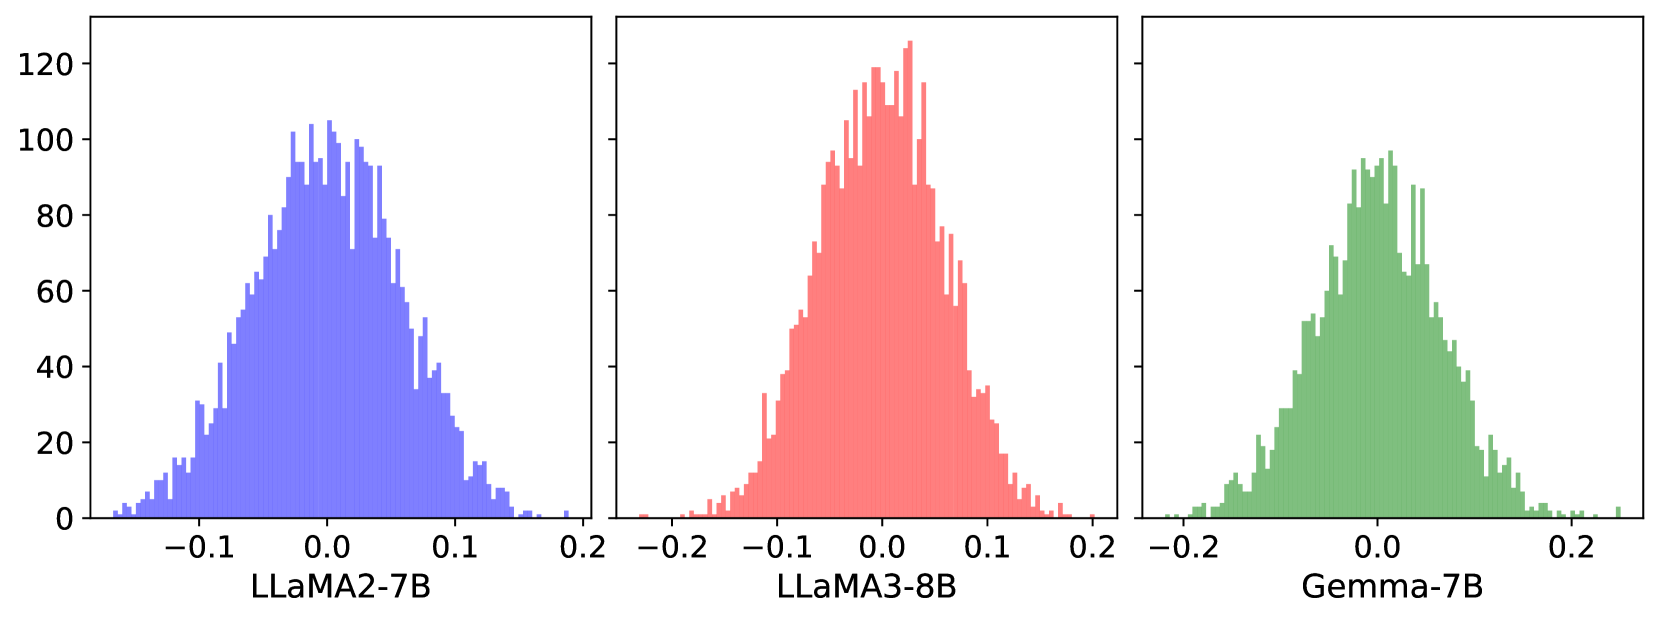
## Histograms: Model Performance Distributions
### Overview
The image displays three side-by-side histograms comparing distributions of a metric (likely model performance) across three language models: LLaMA2-7B (blue), LLaMA3-8B (red), and Gemma-7B (green). Each histogram shows frequency counts (y-axis) against a normalized scale (-0.2 to 0.2) on the x-axis.
### Components/Axes
- **X-Axes**:
- LLaMA2-7B: Range -0.2 to 0.2
- LLaMA3-8B: Range -0.2 to 0.2
- Gemma-7B: Range -0.2 to 0.2
- **Y-Axes**:
- All histograms share a "Count" axis (0 to 120)
- **Legend**:
- Top-center placement
- Blue = LLaMA2-7B
- Red = LLaMA3-8B
- Green = Gemma-7B
### Detailed Analysis
1. **LLaMA2-7B (Blue)**:
- Peak frequency: ~100 at x=0.0
- Symmetric distribution with gradual decline toward ±0.1
- Tails extend to ±0.15 with minimal counts
2. **LLaMA3-8B (Red)**:
- Peak frequency: ~120 at x=0.0
- Narrower distribution than LLaMA2-7B
- Declines sharply to ~40 at ±0.1
3. **Gemma-7B (Green)**:
- Peak frequency: ~100 at x=0.0
- Broader spread than LLaMA3-8B but narrower than LLaMA2-7B
- Tails reach ±0.18 with low counts
### Key Observations
- All distributions are bell-shaped and symmetric, suggesting normal-like distributions.
- LLaMA3-8B has the highest peak frequency (120), indicating a higher concentration of values near 0.0.
- Gemma-7B exhibits the widest spread (up to ±0.18), while LLaMA3-8B is the most concentrated (peaks at ±0.1).
- LLaMA2-7B shows intermediate spread and frequency.
### Interpretation
The histograms likely represent a performance metric (e.g., accuracy, error rate) normalized to a common scale. LLaMA3-8B's higher peak frequency suggests superior performance or consistency in the measured metric compared to the other models. The symmetry implies balanced performance across positive and negative deviations from the mean (0.0). Gemma-7B's broader distribution may indicate greater variability in outcomes, while LLaMA2-7B balances moderate spread and frequency. These patterns could reflect differences in model architecture, training data, or optimization strategies.