## Grid of Image Comparisons: Hierarchical-3DGS vs FLoD-3DGS Performance
### Overview
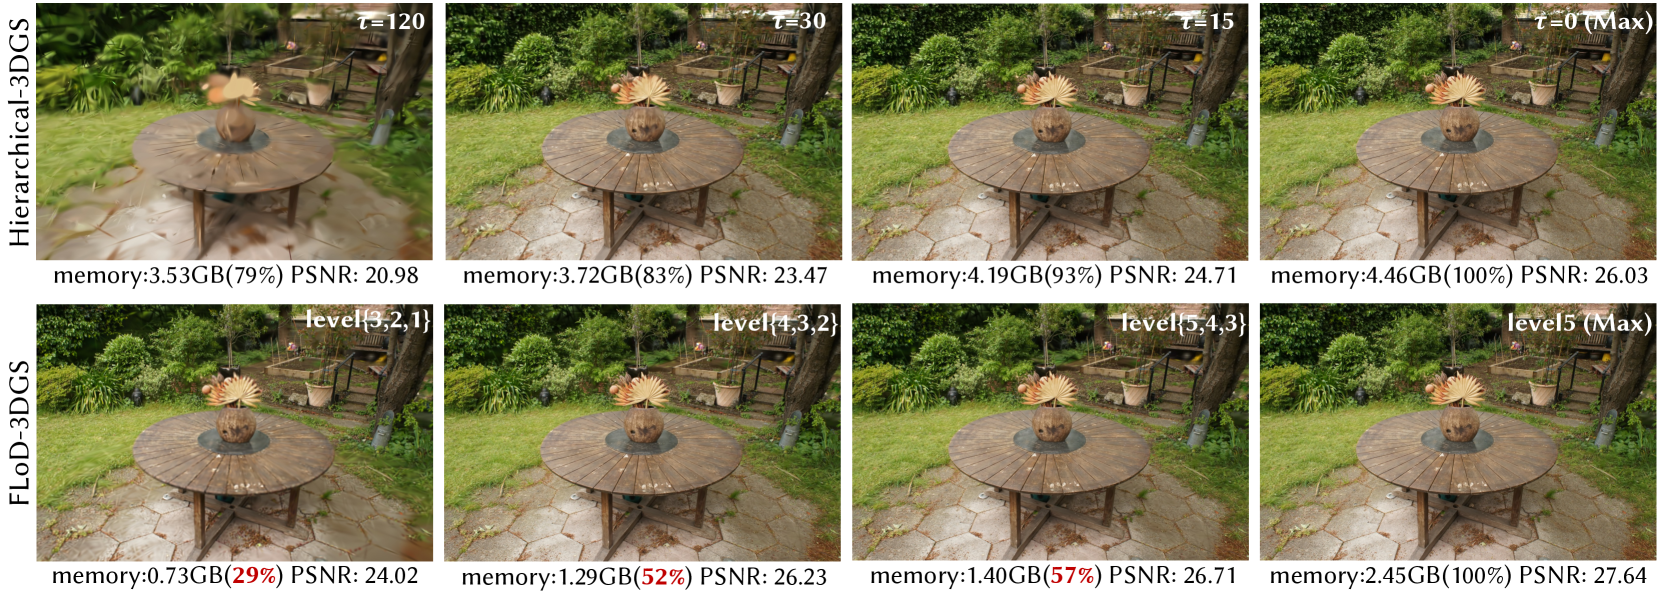
The image presents a comparative analysis of two 3DGS (3D Gaussian Splatting) rendering methods: **Hierarchical-3DGS** (top row) and **FLoD-3DGS** (bottom row). Each row contains four images representing different configurations, annotated with time steps (`t`), levels (`level`), memory usage, and PSNR (Peak Signal-to-Noise Ratio) values. The comparison focuses on rendering quality (PSNR) and memory efficiency across varying computational settings.
---
### Components/Axes
- **Rows**:
- Top row: **Hierarchical-3DGS**
- Bottom row: **FLoD-3DGS**
- **Columns (Left to Right)**:
1. `t=120` (lowest quality)
2. `t=30`
3. `t=15`
4. `t=0 (Max)` (highest quality)
- **Annotations**:
- **Levels**: `level{3,2,1}`, `level{4,3,2}`, `level{5,4,3}`, `level5 (Max)`
- **Memory**: Expressed as `X.XXGB(Y%)` (e.g., `3.53GB(79%)`)
- **PSNR**: Numerical values (e.g., `20.98`)
---
### Detailed Analysis
#### Hierarchical-3DGS (Top Row)
1. **`t=120`**:
- Memory: `3.53GB(79%)`
- PSNR: `20.98`
2. **`t=30`**:
- Memory: `3.72GB(83%)`
- PSNR: `23.47`
3. **`t=15`**:
- Memory: `4.19GB(93%)`
- PSNR: `24.71`
4. **`t=0 (Max)`**:
- Memory: `4.46GB(100%)`
- PSNR: `26.03`
#### FLoD-3DGS (Bottom Row)
1. **`level{3,2,1}`**:
- Memory: `0.73GB(29%)`
- PSNR: `24.02`
2. **`level{4,3,2}`**:
- Memory: `1.29GB(52%)`
- PSNR: `26.23`
3. **`level{5,4,3}`**:
- Memory: `1.40GB(57%)`
- PSNR: `26.71`
4. **`level5 (Max)`**:
- Memory: `2.45GB(100%)`
- PSNR: `27.64`
---
### Key Observations
1. **Memory Efficiency**:
- FLoD-3DGS consistently uses **less memory** than Hierarchical-3DGS across all configurations. For example:
- At `t=0 (Max)`, FLoD-3DGS uses `2.45GB` vs. Hierarchical-3DGS’s `4.46GB`.
- At `level{3,2,1}`, FLoD-3DGS uses only `0.73GB` (29% of total memory).
2. **PSNR Trends**:
- Both methods show **improving PSNR** as configurations progress from left to right (lower `t` or higher `level`).
- FLoD-3DGS achieves **higher PSNR** than Hierarchical-3DGS in equivalent configurations. For instance:
- At `t=0 (Max)`, FLoD-3DGS PSNR (`27.64`) exceeds Hierarchical-3DGS (`26.03`).
- At `level{5,4,3}`, FLoD-3DGS PSNR (`26.71`) surpasses Hierarchical-3DGS’s `t=15` PSNR (`24.71`).
3. **Trade-offs**:
- Hierarchical-3DGS sacrifices memory for incremental PSNR gains (e.g., `t=15` to `t=0` increases PSNR by `1.32` but memory by `0.27GB`).
- FLoD-3DGS balances memory and quality more effectively, with steeper PSNR improvements relative to memory usage (e.g., `level{3,2,1}` to `level5` increases PSNR by `3.62` while memory triples).
---
### Interpretation
The data demonstrates that **FLoD-3DGS** outperforms **Hierarchical-3DGS** in both memory efficiency and rendering quality. Key insights include:
- **Optimization**: FLoD-3DGS achieves higher PSNR with significantly lower memory consumption, suggesting superior algorithmic design for resource-constrained scenarios.
- **Scalability**: FLoD-3DGS’s `level5 (Max)` configuration matches Hierarchical-3DGS’s `t=0 (Max)` quality while using half the memory (`2.45GB` vs. `4.46GB`).
- **Practical Implications**: For applications prioritizing memory efficiency (e.g., real-time rendering), FLoD-3DGS is preferable. Hierarchical-3DGS may be suitable for scenarios where memory is less constrained but higher baseline quality is required.
No anomalies or outliers are observed; trends align consistently across all configurations.