\n
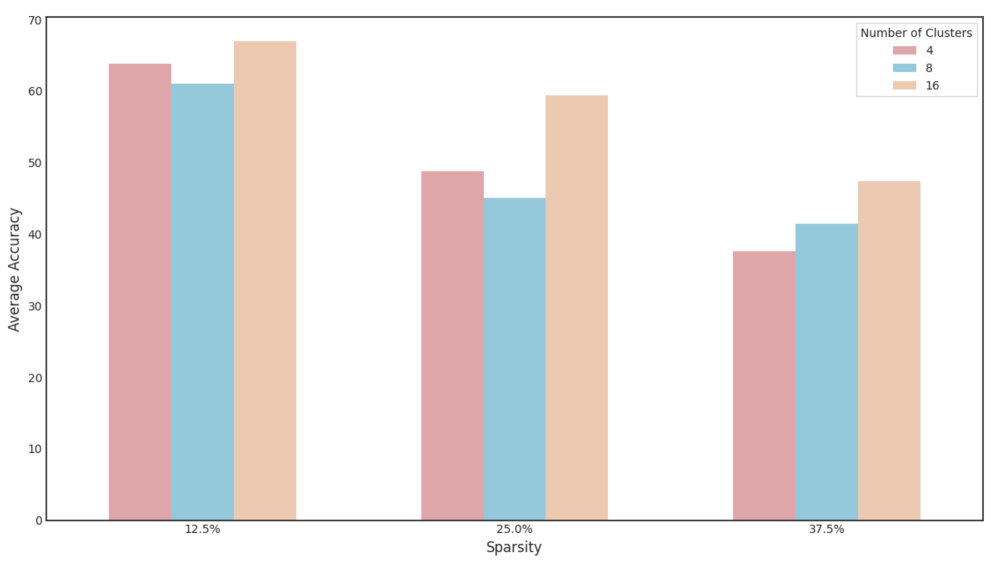
## Bar Chart: Average Accuracy vs. Sparsity for Different Cluster Numbers
### Overview
This bar chart displays the relationship between average accuracy, sparsity, and the number of clusters used in a model. The x-axis represents sparsity levels (12.5%, 25.0%, and 37.5%), and the y-axis represents average accuracy. Three different bar groups are shown for each sparsity level, corresponding to models using 4, 8, and 16 clusters.
### Components/Axes
* **X-axis:** Sparsity (%), with markers at 12.5%, 25.0%, and 37.5%.
* **Y-axis:** Average Accuracy, ranging from 0 to 70.
* **Legend:** Located in the top-right corner, labeling the number of clusters:
* Red: 4
* Orange: 8
* Light Blue: 16
### Detailed Analysis
The chart consists of three groups of bars, one for each sparsity level. Within each group, there are three bars representing the average accuracy for 4, 8, and 16 clusters.
* **12.5% Sparsity:**
* 4 Clusters: Approximately 63.
* 8 Clusters: Approximately 61.
* 16 Clusters: Approximately 65.
* **25.0% Sparsity:**
* 4 Clusters: Approximately 48.
* 8 Clusters: Approximately 56.
* 16 Clusters: Approximately 53.
* **37.5% Sparsity:**
* 4 Clusters: Approximately 39.
* 8 Clusters: Approximately 44.
* 16 Clusters: Approximately 46.
The trend for each sparsity level is as follows:
* **12.5%:** The accuracy increases as the number of clusters increases from 4 to 16.
* **25.0%:** The accuracy increases from 4 to 8 clusters, then decreases slightly from 8 to 16 clusters.
* **37.5%:** The accuracy increases as the number of clusters increases from 4 to 16.
### Key Observations
* At 12.5% sparsity, using 16 clusters yields the highest average accuracy (approximately 65).
* At 25.0% sparsity, using 8 clusters yields the highest average accuracy (approximately 56).
* As sparsity increases, the overall average accuracy tends to decrease.
* The performance difference between 4 and 8 clusters is more pronounced at lower sparsity levels.
### Interpretation
The data suggests that the optimal number of clusters depends on the sparsity level. At lower sparsity levels (12.5%), increasing the number of clusters generally improves accuracy. However, at higher sparsity levels (37.5%), the accuracy improvement from increasing the number of clusters is less significant. The dip in accuracy at 25% sparsity with 16 clusters suggests that there might be an overfitting issue or that the optimal number of clusters is between 8 and 16 for that sparsity level.
The relationship between sparsity and accuracy indicates that as the data becomes more sparse (more missing values or less information), the model's ability to achieve high accuracy decreases. This is likely because sparse data provides less information for the clustering algorithm to work with. The interplay between sparsity and the number of clusters highlights the importance of tuning these parameters to achieve optimal performance for a given dataset.