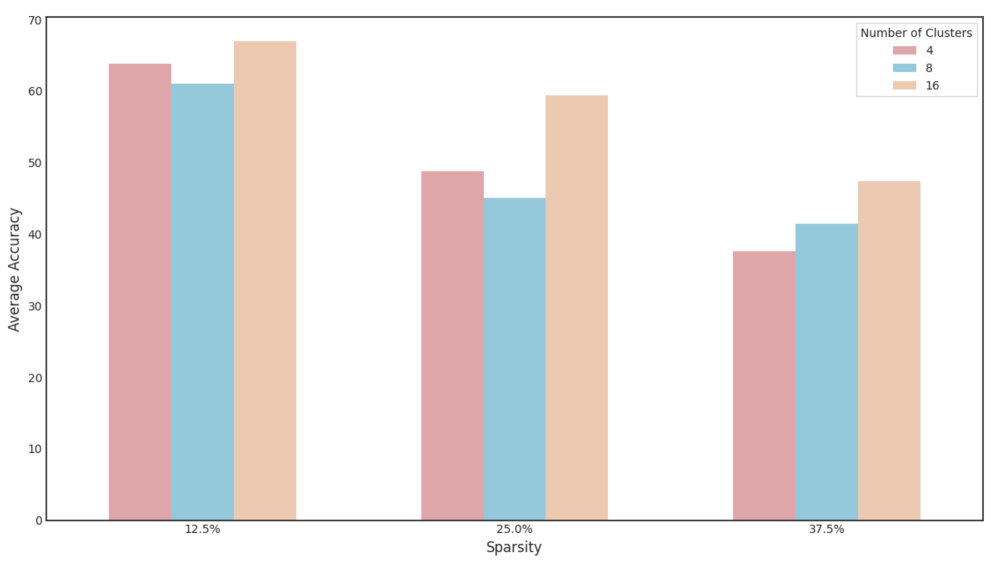
## Grouped Bar Chart: Average Accuracy vs. Sparsity for Different Cluster Counts
### Overview
This is a grouped bar chart comparing the "Average Accuracy" of a model or algorithm across three different levels of "Sparsity" (12.5%, 25.0%, and 37.5%). For each sparsity level, performance is shown for three different configurations, defined by the "Number of Clusters" (4, 8, and 16). The chart demonstrates how accuracy changes as sparsity increases and how the number of clusters influences this relationship.
### Components/Axes
* **Chart Type:** Grouped (clustered) vertical bar chart.
* **X-Axis (Horizontal):**
* **Label:** "Sparsity"
* **Categories (from left to right):** "12.5%", "25.0%", "37.5%"
* **Y-Axis (Vertical):**
* **Label:** "Average Accuracy"
* **Scale:** Linear, ranging from 0 to 70, with major tick marks every 10 units (0, 10, 20, 30, 40, 50, 60, 70).
* **Legend:**
* **Title:** "Number of Clusters"
* **Location:** Top-right corner of the chart area.
* **Items (from top to bottom):**
1. **Color:** Muted rose/mauve. **Label:** "4"
2. **Color:** Light sky blue. **Label:** "8"
3. **Color:** Light peach/beige. **Label:** "16"
### Detailed Analysis
Data values are approximate, estimated from the bar heights relative to the y-axis scale.
**1. At 12.5% Sparsity (Leftmost Group):**
* **Trend:** This group shows the highest overall accuracy levels. The 16-cluster configuration performs best, followed by 4 clusters, with 8 clusters performing slightly worse than 4.
* **Data Points:**
* **4 Clusters (Rose):** ~64
* **8 Clusters (Blue):** ~61
* **16 Clusters (Peach):** ~67
**2. At 25.0% Sparsity (Middle Group):**
* **Trend:** All accuracy values drop compared to 12.5% sparsity. The relative order remains the same: 16 clusters > 4 clusters > 8 clusters.
* **Data Points:**
* **4 Clusters (Rose):** ~49
* **8 Clusters (Blue):** ~45
* **16 Clusters (Peach):** ~59
**3. At 37.5% Sparsity (Rightmost Group):**
* **Trend:** Accuracy decreases further for all configurations. The performance gap between 4 and 8 clusters narrows significantly, with 8 clusters now slightly outperforming 4. The 16-cluster configuration maintains a clear lead.
* **Data Points:**
* **4 Clusters (Rose):** ~38
* **8 Clusters (Blue):** ~41
* **16 Clusters (Peach):** ~47
### Key Observations
1. **Dominant Trend - Sparsity Impact:** There is a clear, consistent negative correlation between sparsity and average accuracy. As sparsity increases from 12.5% to 37.5%, the accuracy for every cluster configuration decreases substantially.
2. **Dominant Trend - Cluster Impact:** The configuration with **16 clusters consistently achieves the highest average accuracy** at every sparsity level tested.
3. **Non-Linear Cluster Performance:** The relationship between cluster count and accuracy is not strictly monotonic. At lower sparsity (12.5% and 25.0%), the 8-cluster configuration performs *worse* than the 4-cluster configuration. This anomaly disappears at the highest sparsity (37.5%), where 8 clusters slightly outperform 4.
4. **Performance Gap:** The absolute performance advantage of using 16 clusters over 4 or 8 clusters is most pronounced at 25.0% sparsity (a lead of ~10-14 points) and narrows somewhat at the highest sparsity level.
### Interpretation
The data suggests a trade-off between model sparsity and accuracy, which is a common theme in machine learning (e.g., pruning neural networks). Higher sparsity likely leads to a less complex, more efficient model but at the cost of predictive performance.
The consistent superiority of the 16-cluster configuration indicates that, for this specific task and range of sparsity, a higher degree of model complexity (more clusters) is beneficial and can partially mitigate the accuracy loss from increased sparsity. The anomalous underperformance of 8 clusters at lower sparsity is intriguing. It could suggest a non-optimal interaction between the clustering mechanism and the model's feature space at that specific complexity level, or it might be an artifact of the specific dataset or experimental setup used to generate this chart.
**Limitations & Context:** The chart lacks a specific title describing the model or task (e.g., "Image Classification on CIFAR-10"). The "Average Accuracy" metric is not defined (e.g., top-1, top-5). Without this context, the interpretation is generalized. The findings imply that if one must increase sparsity for efficiency, using a higher number of clusters (16 in this case) is a viable strategy to preserve accuracy. The optimal number of clusters, however, appears to depend on the operating sparsity level.