## Bar Chart: Accuracy Comparison Across Models and Methods
### Overview
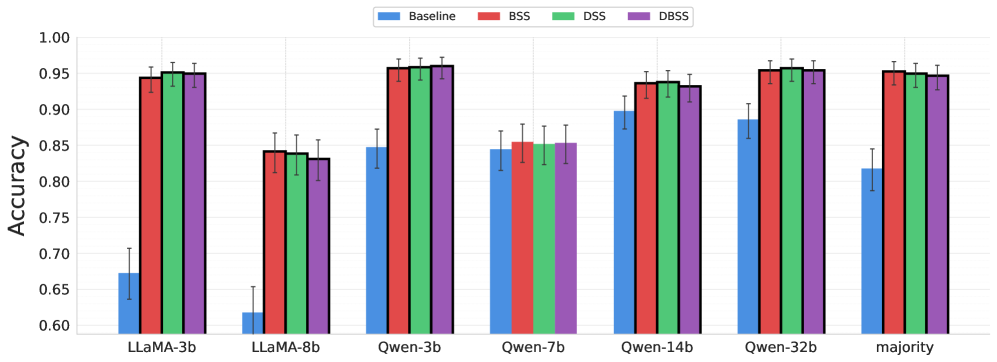
The chart compares the accuracy of four methods (Baseline, BSS, DSS, DBSS) across seven models/methods (LLaMA-3b, LLaMA-8b, Qwen-3b, Qwen-7b, Qwen-14b, Qwen-32b, majority). Accuracy is measured on a scale from 0.60 to 1.00, with error bars indicating variability.
### Components/Axes
- **X-axis**: Models/methods (LLaMA-3b, LLaMA-8b, Qwen-3b, Qwen-7b, Qwen-14b, Qwen-32b, majority).
- **Y-axis**: Accuracy (0.60–1.00).
- **Legend**:
- Blue: Baseline
- Red: BSS
- Green: DSS
- Purple: DBSS
- **Error Bars**: Vertical lines atop bars representing variability (uncertainty not quantified numerically).
### Detailed Analysis
1. **Baseline (Blue)**:
- Consistently the lowest accuracy across all models.
- Values range from ~0.62 (LLaMA-8b) to ~0.82 (Qwen-32b).
- Error bars suggest moderate variability (e.g., ~±0.03 for Qwen-32b).
2. **BSS (Red)**:
- Outperforms Baseline in all cases.
- Highest accuracy for Qwen-32b (~0.96) and majority (~0.95).
- Lowest accuracy for LLaMA-8b (~0.84).
3. **DSS (Green)**:
- Slightly higher than BSS in most cases.
- Peaks at Qwen-32b (~0.96) and majority (~0.95).
- Lowest at LLaMA-8b (~0.83).
4. **DBSS (Purple)**:
- Matches or slightly exceeds DSS in most cases.
- Highest accuracy for Qwen-32b (~0.96) and majority (~0.95).
- Lowest at LLaMA-8b (~0.82).
5. **Model/Method Performance**:
- **Majority**: Highest accuracy across all methods (~0.94–0.96).
- **Qwen-32b**: Second-highest accuracy for all methods (~0.94–0.96).
- **Qwen-14b/Qwen-7b**: Mid-range performance (~0.88–0.94).
- **LLaMA-8b**: Lowest accuracy for all methods (~0.82–0.85).
- **LLaMA-3b**: Slightly better than LLaMA-8b (~0.84–0.95).
### Key Observations
- **Baseline Underperformance**: The Baseline method is consistently the weakest, with accuracy ~0.1–0.2 lower than other methods.
- **Majority Dominance**: The "majority" method achieves the highest accuracy, suggesting aggregation or consensus-based approaches are effective.
- **Qwen Superiority**: Qwen models (especially 32b) outperform LLaMA models across all methods.
- **Error Bar Consistency**: Variability is relatively uniform across methods, with no extreme outliers.
### Interpretation
The data demonstrates that **BSS, DSS, and DBSS methods significantly improve accuracy over the Baseline**, with the "majority" method and larger Qwen models (32b) achieving the best results. This suggests:
1. **Method Impact**: BSS/DSS/DBSS likely incorporate mechanisms (e.g., sampling, ensembling) that enhance performance compared to the Baseline.
2. **Model Size/Architecture**: Larger Qwen models (32b) outperform smaller LLaMA models, indicating that model capacity or training data may influence results.
3. **Majority Effect**: The "majority" category’s high accuracy implies that consensus-based strategies (e.g., voting) are robust across models.
The Baseline’s consistent underperformance highlights the importance of method selection, while the Qwen/LLaMA disparity suggests architectural or training differences. Error bars indicate moderate uncertainty, but no method shows extreme variability.