## Line Chart: Model Accuracy vs. Time
### Overview
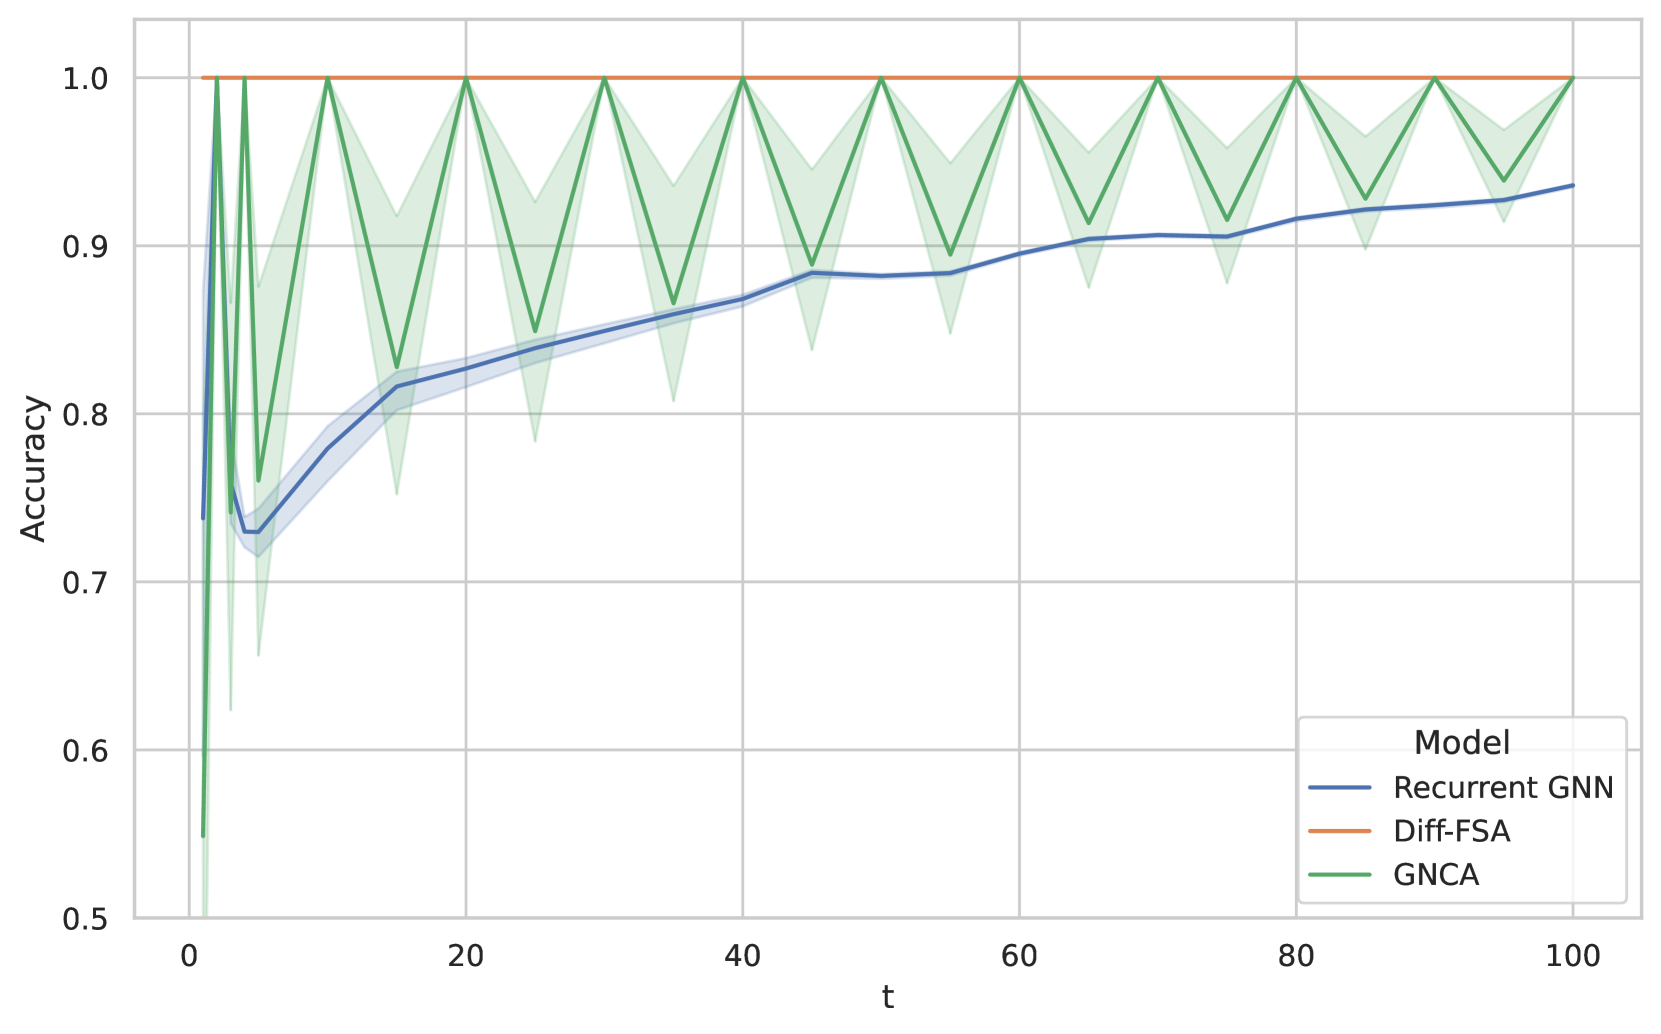
The image is a line chart comparing the accuracy of three different models (Recurrent GNN, Diff-FSA, and GNCA) over time. The x-axis represents time ('t'), and the y-axis represents accuracy.
### Components/Axes
* **X-axis:** 't' (Time). Scale ranges from 0 to 100, with tick marks at 0, 20, 40, 60, 80, and 100.
* **Y-axis:** 'Accuracy'. Scale ranges from 0.5 to 1.0, with tick marks at 0.5, 0.6, 0.7, 0.8, 0.9, and 1.0.
* **Legend (bottom-right):**
* Recurrent GNN (Blue line with shaded area)
* Diff-FSA (Orange line)
* GNCA (Green line with shaded area)
### Detailed Analysis
* **Recurrent GNN (Blue):**
* Trend: Initially decreases, then steadily increases over time.
* Data Points:
* t=0, Accuracy ≈ 0.75
* t=5, Accuracy ≈ 0.72
* t=10, Accuracy ≈ 0.78
* t=20, Accuracy ≈ 0.82
* t=40, Accuracy ≈ 0.88
* t=60, Accuracy ≈ 0.88
* t=80, Accuracy ≈ 0.92
* t=100, Accuracy ≈ 0.93
* **Diff-FSA (Orange):**
* Trend: Constant accuracy over time.
* Data Points:
* Accuracy ≈ 1.0 for all values of t.
* **GNCA (Green):**
* Trend: Oscillates between a high and low accuracy value, forming a repeating triangular pattern.
* Data Points:
* t=0, Accuracy ≈ 0.55
* t=5, Accuracy ≈ 1.0
* t=15, Accuracy ≈ 0.82
* t=25, Accuracy ≈ 1.0
* t=35, Accuracy ≈ 0.85
* t=45, Accuracy ≈ 1.0
* t=55, Accuracy ≈ 0.85
* t=65, Accuracy ≈ 1.0
* t=75, Accuracy ≈ 0.88
* t=85, Accuracy ≈ 1.0
* t=95, Accuracy ≈ 0.92
### Key Observations
* Diff-FSA consistently achieves perfect accuracy (1.0) throughout the entire time range.
* Recurrent GNN shows a gradual improvement in accuracy over time, starting lower than Diff-FSA but approaching it.
* GNCA exhibits a fluctuating accuracy, with periodic peaks and troughs.
### Interpretation
The chart compares the performance of three machine learning models in terms of accuracy over time. Diff-FSA demonstrates superior and stable performance, achieving perfect accuracy. Recurrent GNN shows a learning curve, gradually improving its accuracy. GNCA's oscillating accuracy suggests instability or sensitivity to the time variable. The shaded regions around the Recurrent GNN and GNCA lines likely represent the variance or confidence intervals of the accuracy measurements. The data suggests that Diff-FSA is the most reliable model for this particular task, while Recurrent GNN requires more training time to reach optimal performance, and GNCA's performance is inconsistent.