## Line Chart: Model Accuracy Over Time
### Overview
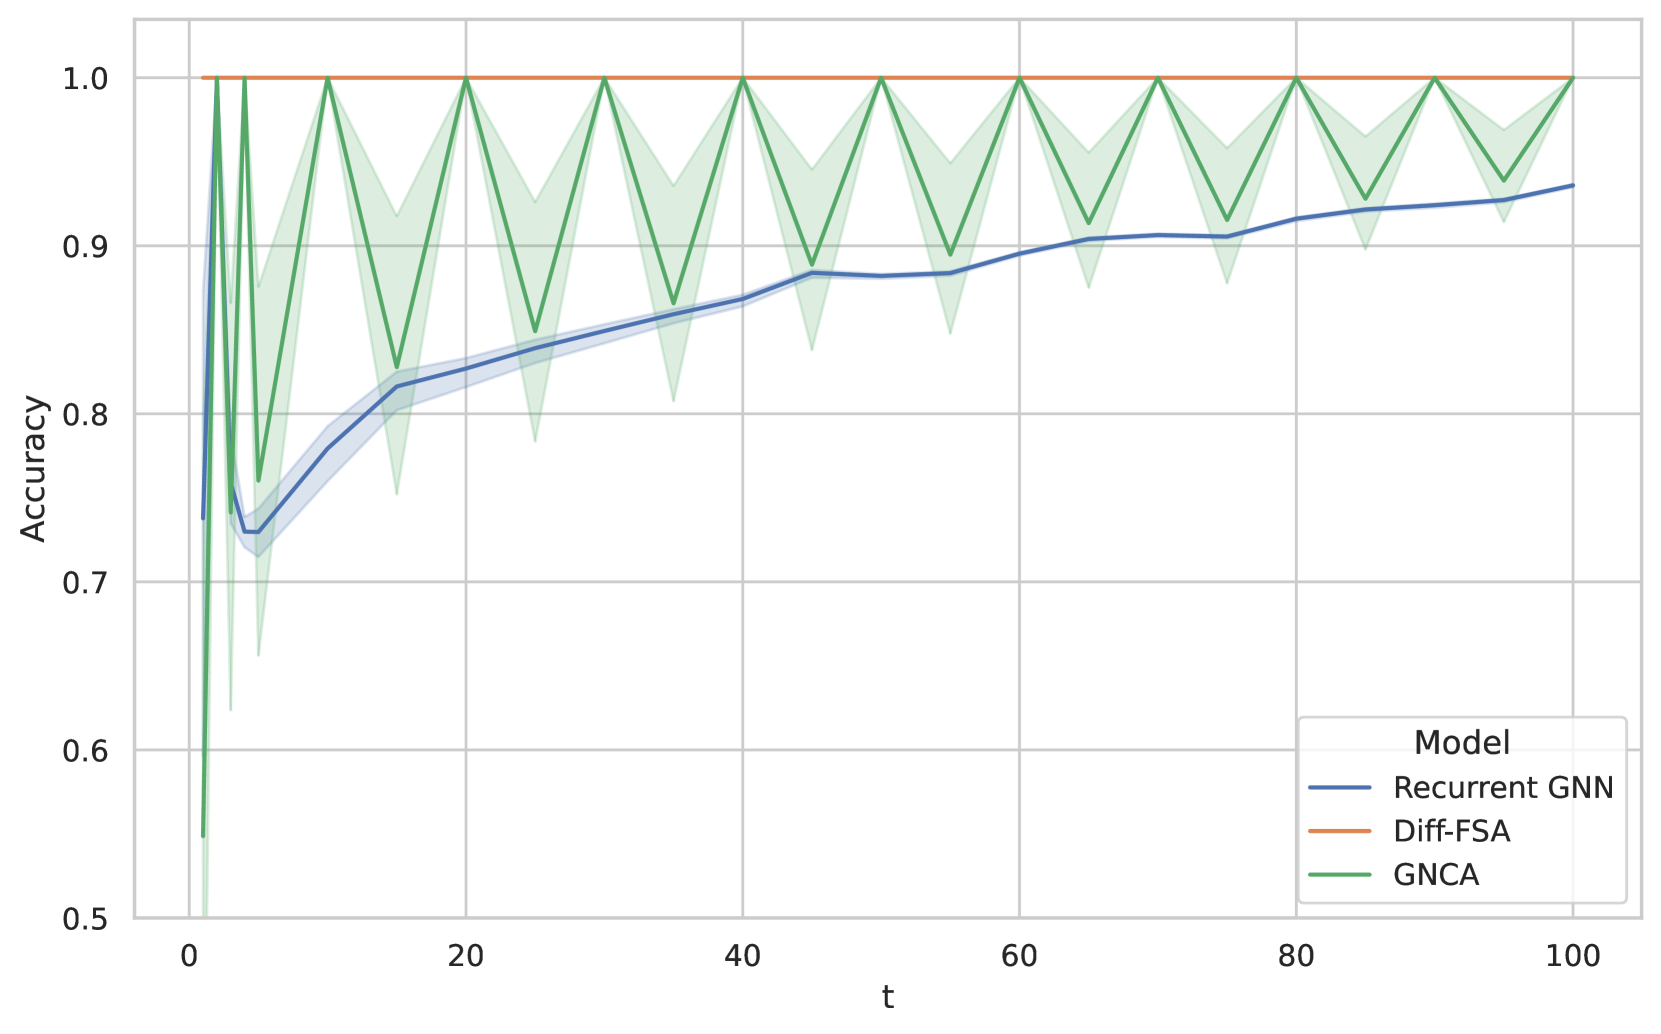
The chart displays the accuracy of three machine learning models (Recurrent GNN, Diff-FSA, GNCA) across a time axis (t) from 0 to 100. Accuracy is measured on a scale from 0.5 to 1.0. The chart includes shaded confidence intervals for each model, with the Recurrent GNN and GNCA showing variability, while Diff-FSA maintains a constant value.
### Components/Axes
- **X-axis (t)**: Time, ranging from 0 to 100 in increments of 20.
- **Y-axis (Accuracy)**: Accuracy values from 0.5 to 1.0 in increments of 0.1.
- **Legend**: Located in the bottom-right corner, associating colors with models:
- **Blue**: Recurrent GNN
- **Orange**: Diff-FSA
- **Green**: GNCA
### Detailed Analysis
1. **Recurrent GNN (Blue Line)**:
- Starts at approximately 0.7 at t=0, with a sharp initial increase.
- Peaks at ~0.95 by t=100, showing a steady upward trend.
- Confidence interval (shaded blue) is narrow, indicating low variability.
2. **Diff-FSA (Orange Line)**:
- Maintains a constant accuracy of 1.0 across all t values.
- Confidence interval is minimal (nearly flat), suggesting high certainty.
3. **GNCA (Green Line)**:
- Exhibits a V-shaped pattern, starting at 1.0 at t=0, dipping to ~0.85 at t=20, and returning to 1.0 at t=100.
- Confidence interval (shaded green) is the widest, indicating significant variability.
### Key Observations
- **Diff-FSA** achieves perfect accuracy (1.0) consistently, with no deviation.
- **GNCA** shows the most fluctuation, with accuracy dropping to ~0.85 at t=20 and recovering by t=100.
- **Recurrent GNN** demonstrates a gradual improvement, starting at ~0.7 and reaching ~0.95 by t=100.
- The shaded areas (confidence intervals) highlight that GNCA has the highest uncertainty, while Diff-FSA has the lowest.
### Interpretation
- **Diff-FSA's Consistency**: The flat orange line suggests this model is either inherently stable or optimized for the task, with no variability in performance.
- **GNCA's Variability**: The V-shaped pattern and wide confidence interval imply potential instability or sensitivity to input changes, despite achieving perfect accuracy at specific points.
- **Recurrent GNN's Growth**: The upward trend indicates the model improves over time, possibly due to learning from sequential data.
- **Confidence Intervals**: The width of the shaded regions directly correlates with model uncertainty. GNCA's wide intervals suggest less reliable predictions compared to the other models.
This chart highlights trade-offs between model stability (Diff-FSA), adaptability (Recurrent GNN), and variability (GNCA), with implications for deployment in dynamic environments.