## Bar Chart: Average Episode Length Comparison
### Overview
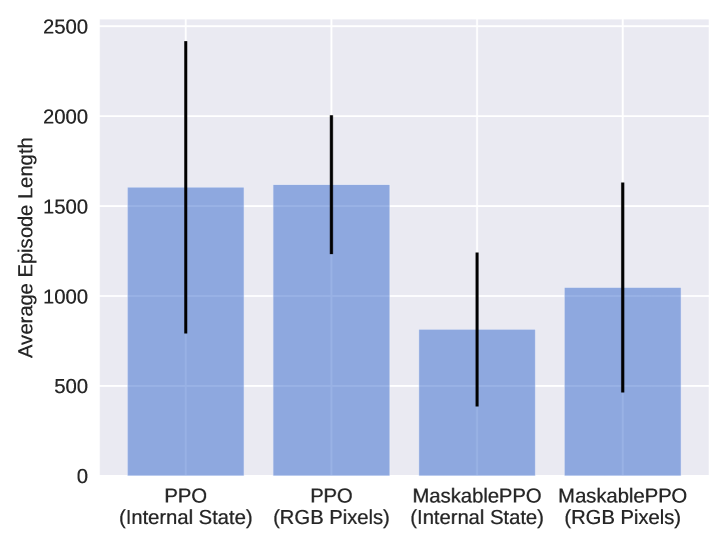
The image is a bar chart comparing the average episode length of two reinforcement learning algorithms, PPO and MaskablePPO, under two different input conditions: "Internal State" and "RGB Pixels". The chart displays the average episode length as the height of the bars, with error bars indicating the variability or standard deviation.
### Components/Axes
* **Y-axis:** "Average Episode Length", with a numerical scale from 0 to 2500 in increments of 500.
* **X-axis:** Categorical axis representing the different algorithm and input combinations:
* PPO (Internal State)
* PPO (RGB Pixels)
* MaskablePPO (Internal State)
* MaskablePPO (RGB Pixels)
* **Bars:** Light blue bars represent the average episode length for each category.
* **Error Bars:** Black vertical lines extending above and below each bar, indicating the range of variability.
### Detailed Analysis
The chart presents four distinct data points, each representing a different configuration of the reinforcement learning algorithm.
* **PPO (Internal State):** The average episode length is approximately 1600. The error bar extends from approximately 700 to 2500.
* **PPO (RGB Pixels):** The average episode length is approximately 1600. The error bar extends from approximately 1250 to 2000.
* **MaskablePPO (Internal State):** The average episode length is approximately 800. The error bar extends from approximately 300 to 1250.
* **MaskablePPO (RGB Pixels):** The average episode length is approximately 1050. The error bar extends from approximately 450 to 1650.
### Key Observations
* PPO has a higher average episode length than MaskablePPO, regardless of the input type (Internal State or RGB Pixels).
* The error bars for PPO (Internal State) and MaskablePPO (RGB Pixels) are larger, indicating greater variability in episode length.
* The error bars for PPO (RGB Pixels) and MaskablePPO (Internal State) are smaller, indicating less variability in episode length.
### Interpretation
The data suggests that the PPO algorithm generally results in longer episodes compared to MaskablePPO. This could indicate that PPO is more effective at exploring the environment or achieving a more stable policy. The use of "Internal State" versus "RGB Pixels" as input seems to have a less consistent impact, with the variability being more pronounced in some cases than others. The large error bars suggest that the performance of these algorithms can vary significantly from episode to episode, especially for PPO with internal state and MaskablePPO with RGB pixels. Further investigation would be needed to understand the factors contributing to this variability and to determine the statistical significance of the observed differences.