## [Diagram Type]: Knowledge Graph Types (Encyclopedic, Commonsense, Domain-specific, Multi-modal)
### Overview
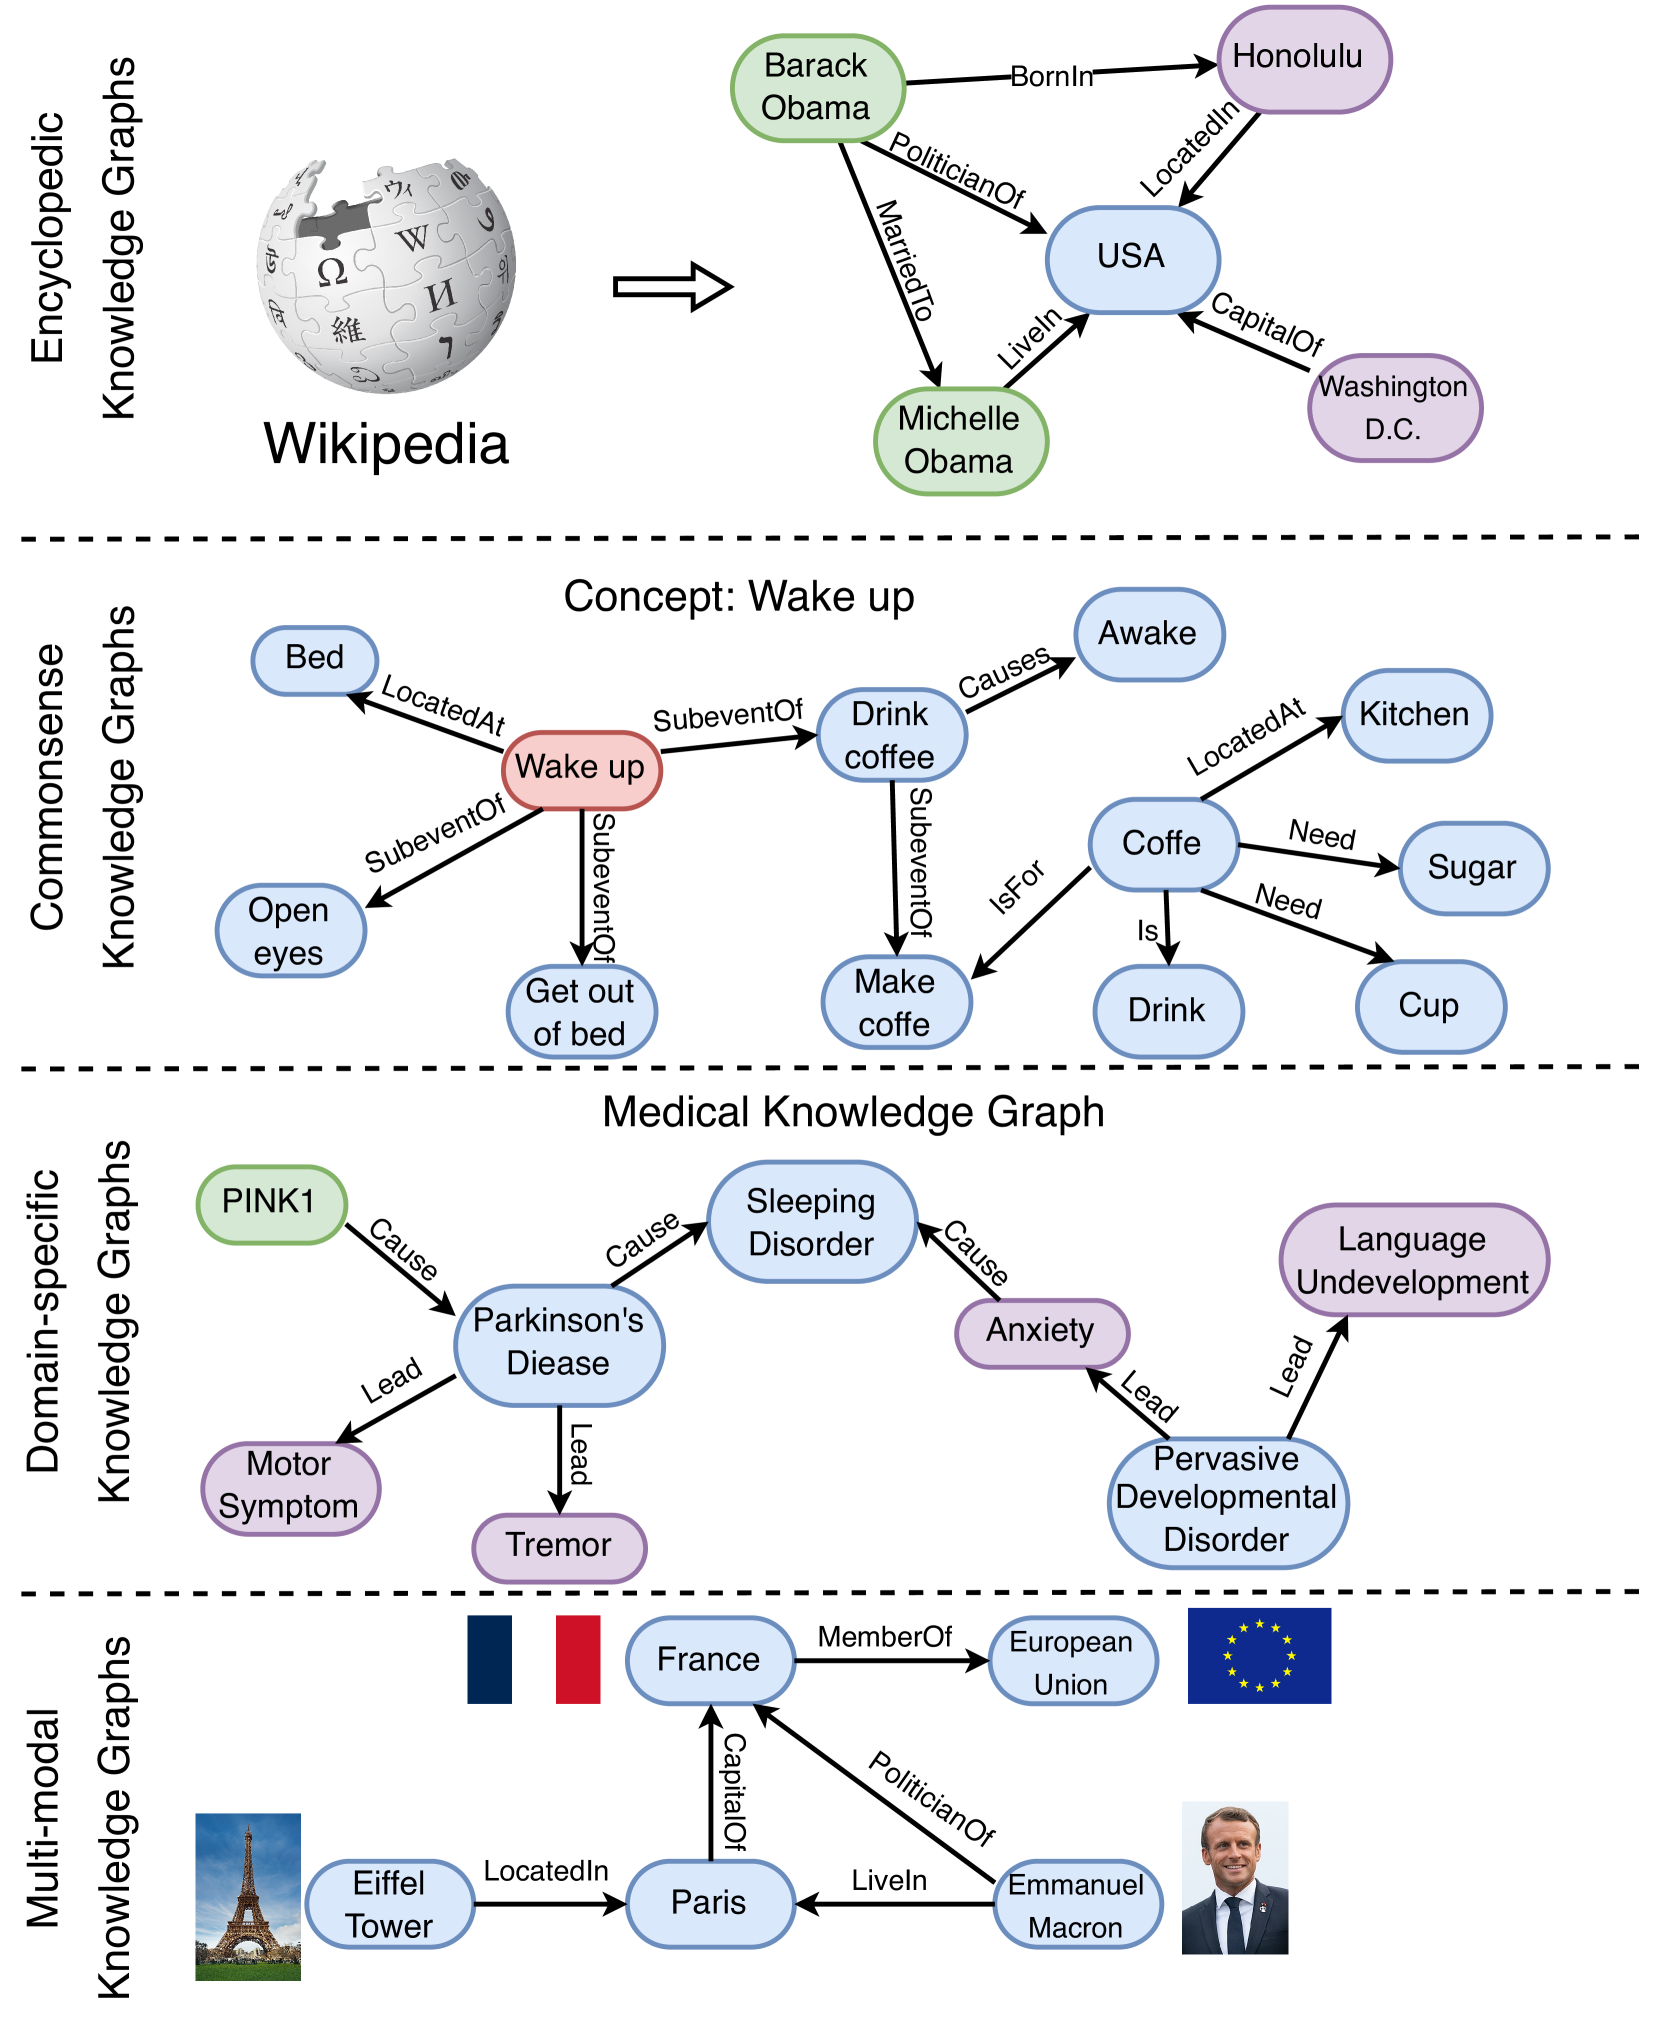
The image is a vertical diagram divided into four horizontal sections (separated by dashed lines), each illustrating a type of **knowledge graph** (a structured representation of entities and their relationships). Sections are labeled on the left: *Encyclopedic*, *Commonsense*, *Domain-specific*, and *Multi-modal*. Each section includes a title, a graph with nodes (entities) and edges (relationships), and visual elements (icons, images) to contextualize the knowledge type.
### Components/Axes (Sections)
The diagram is segmented into four horizontal regions (top to bottom):
#### 1. Encyclopedic Knowledge Graphs (Top Section)
- **Left Icon**: Wikipedia logo (puzzle globe with “W” and multilingual symbols) labeled *“Wikipedia”*.
- **Graph Nodes** (color-coded):
- Green: *Barack Obama*, *Michelle Obama* (people).
- Purple: *Honolulu*, *Washington D.C.* (places).
- Blue: *USA* (organization).
- **Graph Edges** (relationships):
- *BornIn* (Barack Obama → Honolulu), *PoliticianOf* (Barack Obama → USA), *MarriedTo* (Barack Obama → Michelle Obama), *LiveIn* (Michelle Obama → USA), *LocatedIn* (Honolulu → USA), *CapitalOf* (Washington D.C. → USA).
#### 2. Commonsense Knowledge Graphs (Second Section)
- **Title**: *“Concept: Wake up”* (centered top).
- **Graph Nodes** (color-coded):
- Red: *Wake up* (central concept).
- Blue: *Bed*, *Open eyes*, *Get out of bed*, *Drink coffee*, *Awake*, *Make coffee*, *Coffee*, *Kitchen*, *Sugar*, *Cup*, *Drink* (everyday actions/objects).
- **Graph Edges** (relationships):
- *LocatedAt* (Bed → Wake up), *SubeventOf* (Open eyes → Wake up), *SubeventOf* (Get out of bed → Wake up), *SubeventOf* (Drink coffee → Wake up), *Causes* (Drink coffee → Awake), *SubeventOf* (Make coffee → Drink coffee), *IsFor* (Coffee → Make coffee), *LocatedAt* (Coffee → Kitchen), *Need* (Coffee → Sugar), *Need* (Coffee → Cup), *Is* (Coffee → Drink).
#### 3. Domain-specific Knowledge Graphs (Third Section)
- **Title**: *“Medical Knowledge Graph”* (centered top).
- **Graph Nodes** (color-coded):
- Green: *PINK1* (genetic factor).
- Blue: *Parkinson’s Disease*, *Sleeping Disorder*, *Pervasive Developmental Disorder* (diseases/disorders).
- Purple: *Motor Symptom*, *Tremor*, *Anxiety*, *Language Undevelopment* (symptoms).
- **Graph Edges** (relationships):
- *Cause* (PINK1 → Parkinson’s Disease), *Lead* (Parkinson’s Disease → Motor Symptom), *Lead* (Parkinson’s Disease → Tremor), *Cause* (Parkinson’s Disease → Sleeping Disorder), *Cause* (Sleeping Disorder → Anxiety), *Lead* (Anxiety → Pervasive Developmental Disorder), *Lead* (Pervasive Developmental Disorder → Language Undevelopment).
#### 4. Multi-modal Knowledge Graphs (Bottom Section)
- **Visual Elements**:
- Left: Image of the *Eiffel Tower* (labeled *“Eiffel Tower”*).
- Icons: French flag (left of *France* node), EU flag (right of *European Union* node), photo of *Emmanuel Macron* (right of his node).
- **Graph Nodes** (blue): *Eiffel Tower*, *Paris*, *France*, *European Union*, *Emmanuel Macron*.
- **Graph Edges** (relationships):
- *LocatedIn* (Eiffel Tower → Paris), *CapitalOf* (Paris → France), *MemberOf* (France → European Union), *PoliticianOf* (Emmanuel Macron → France), *LiveIn* (Emmanuel Macron → Paris).
### Key Observations
- **Color Coding**: Distinguishes entity types (e.g., green = people, purple = places, blue = organizations/diseases).
- **Relationship Types**: Edges define spatial (*LocatedIn*), causal (*Cause*), hierarchical (*SubeventOf*), and functional (*Need*, *IsFor*) relationships.
- **Multi-modal Integration**: Combines text nodes with visual elements (images, flags) to represent entities (e.g., Eiffel Tower image, French flag).
### Interpretation
This diagram illustrates how knowledge is structured across domains:
- **Encyclopedic**: Captures factual, general knowledge (e.g., Wikipedia-style entities/relationships).
- **Commonsense**: Encodes everyday reasoning (e.g., “waking up” involves subevents like “opening eyes” or “drinking coffee”).
- **Domain-specific**: Specialized for fields like medicine, capturing causal links (e.g., *PINK1* → *Parkinson’s Disease* → *Tremor*).
- **Multi-modal**: Integrates text and visual information (e.g., Eiffel Tower image + “LocatedIn Paris”), enabling tasks like image-text understanding.
Each type serves a unique purpose: encyclopedic for general knowledge, commonsense for AI reasoning, domain-specific for expert systems, and multi-modal for cross-modal tasks. The diagram emphasizes the diversity of knowledge representation, showing how structure (nodes, edges, visuals) adapts to the information’s nature.