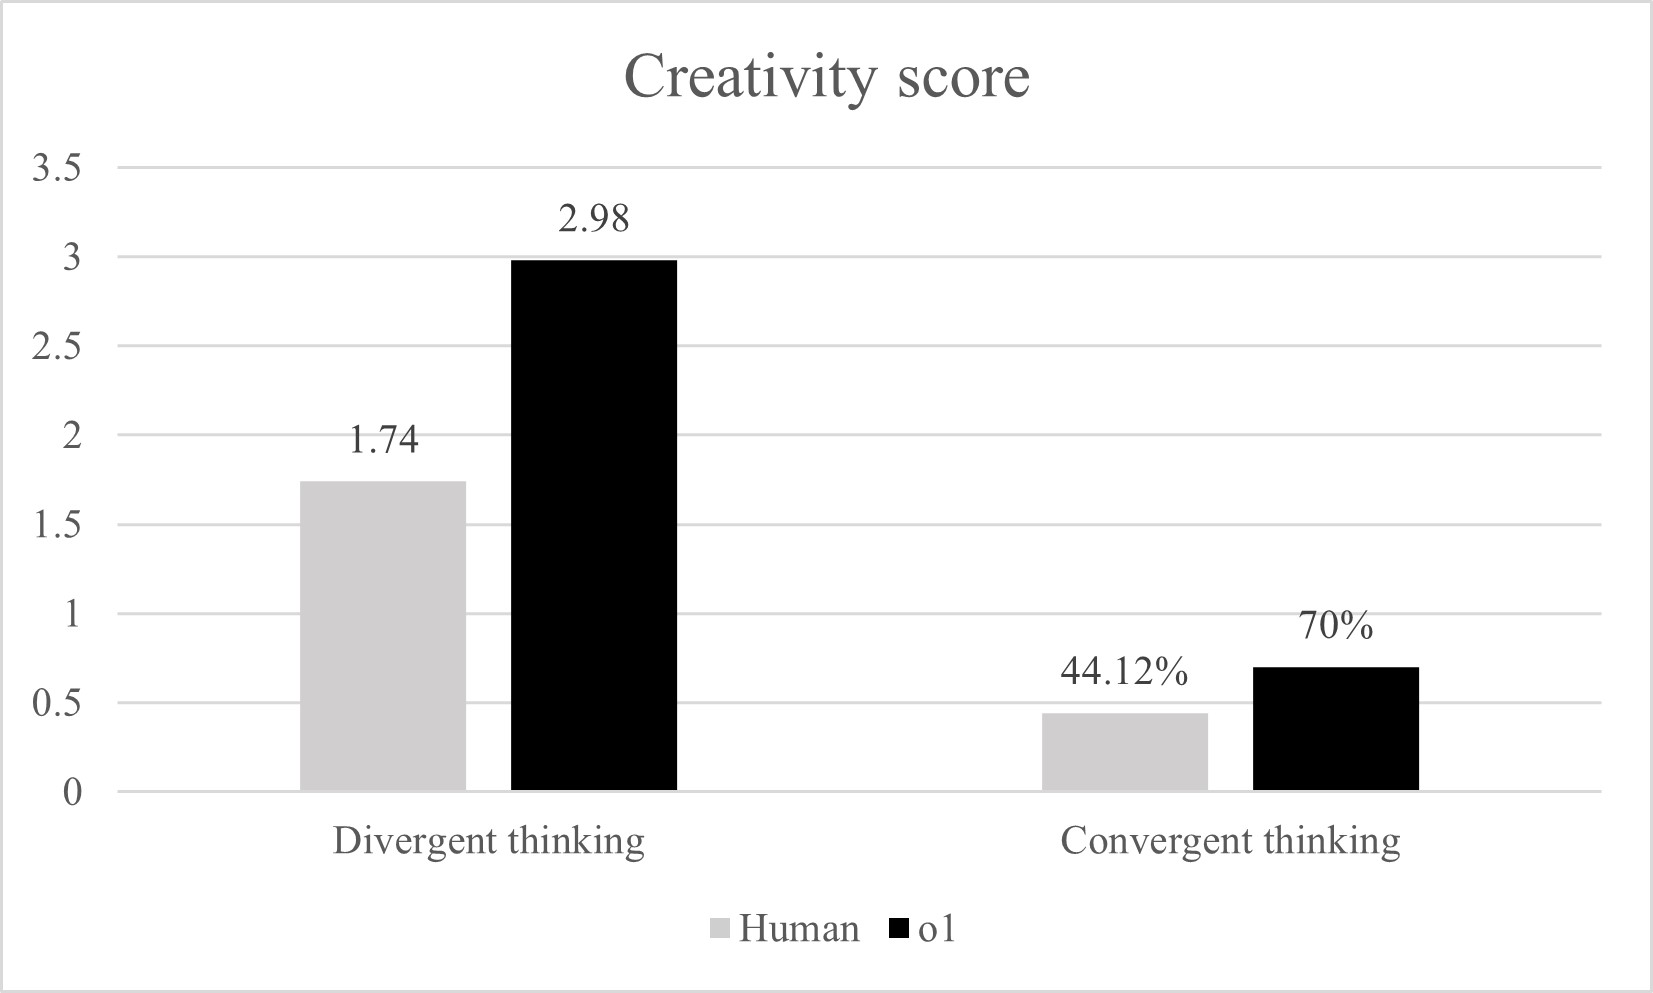
## Bar Chart: Creativity Score
### Overview
The chart compares creativity scores between humans and AI systems across two cognitive processes: divergent thinking and convergent thinking. It uses vertical bars to represent scores, with a legend distinguishing human (gray) and AI (black) performance.
### Components/Axes
- **X-axis**: Categorizes data into "Divergent thinking" and "Convergent thinking."
- **Y-axis**: Labeled "Creativity score," scaled from 0 to 3.5 in increments of 0.5.
- **Legend**: Located at the bottom, with gray representing "Human" and black representing "AI."
- **Bar Colors**: Gray for human scores, black for AI scores.
### Detailed Analysis
1. **Divergent Thinking**:
- **Human**: Score of 1.74 (gray bar).
- **AI**: Score of 2.98 (black bar), approximately 1.71 times higher than human performance.
2. **Convergent Thinking**:
- **Human**: Score of 44.12% (gray bar), equivalent to 0.4412 on the y-axis.
- **AI**: Score of 70% (black bar), equivalent to 0.7 on the y-axis, approximately 1.58 times higher than human performance.
### Key Observations
- AI outperforms humans in both categories, with a larger gap in divergent thinking (1.71x) compared to convergent thinking (1.58x).
- The y-axis scales absolute scores (0–3.5) and percentages (0–1.0), suggesting divergent thinking is measured on a different metric than convergent thinking.
- AI’s divergent thinking score (2.98) exceeds the y-axis maximum of 3.5, indicating potential truncation or scaling adjustments.
### Interpretation
The data demonstrates that AI systems surpass human performance in both divergent and convergent thinking tasks. Divergent thinking, which emphasizes creativity and idea generation, shows a more pronounced AI advantage, possibly reflecting AI’s strengths in pattern recognition and rapid ideation. Convergent thinking, focused on optimal solutions, also favors AI but with a smaller margin, suggesting humans retain some edge in tasks requiring nuanced judgment. The use of percentages for convergent thinking may normalize scores for comparability, though the chart does not explicitly clarify this. The visual emphasis on AI’s dominance highlights its growing role in creative and analytical domains, though real-world applications may depend on context-specific task design and evaluation criteria.