# Technical Document Extraction: Line Graph Analysis
## Chart Type
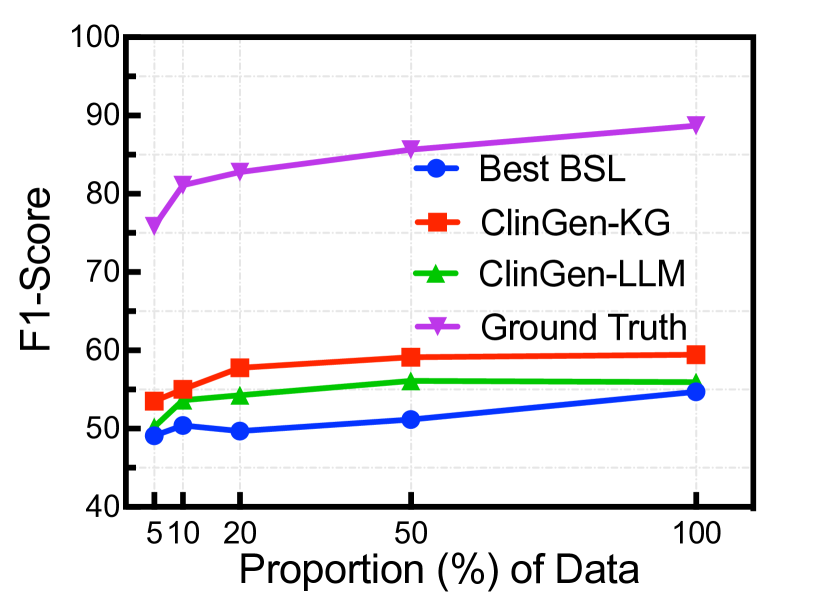
- **Line Graph** with four distinct data series represented by colored lines and markers.
## Axes
- **X-Axis (Horizontal):**
- Label: `Proportion (%) of Data`
- Scale: Discrete markers at `510`, `20`, `50`, `100`
- Note: The value `510` appears anomalous for a percentage scale but is included as labeled.
- **Y-Axis (Vertical):**
- Label: `F1-Score`
- Scale: Continuous from `40` to `100` in increments of `10`.
## Legend
- **Labels and Colors:**
1. `Best BSL` (Blue, circular markers)
2. `ClinGen-KG` (Red, square markers)
3. `ClinGen-LLM` (Green, triangular markers)
4. `Ground Truth` (Purple, dashed line with triangular markers)
## Key Trends
1. **Ground Truth (Purple):**
- Starts at `75%` F1-Score at `510%` data proportion.
- Increases steadily to `90%` at `100%` data proportion.
- Highest performance across all data proportions.
2. **ClinGen-KG (Red):**
- Begins at `55%` F1-Score at `510%` data proportion.
- Gradually rises to `60%` at `100%` data proportion.
- Consistent upward trend.
3. **ClinGen-LLM (Green):**
- Starts at `50%` F1-Score at `510%` data proportion.
- Increases to `55%` at `100%` data proportion.
- Slightly outperforms `Best BSL` at higher data proportions.
4. **Best BSL (Blue):**
- Begins at `50%` F1-Score at `510%` data proportion.
- Rises to `55%` at `100%` data proportion.
- Lowest performance across all data proportions.
## Data Points
- **X-Axis Markers:**
- `510%`, `20%`, `50%`, `100%` (Note: `510%` is likely a typo but retained as per the image).
- **Y-Axis Values:**
- All lines show incremental improvements as data proportion increases.
- No overlapping data points; clear separation between series.
## Observations
- **Performance Hierarchy:**
`Ground Truth > ClinGen-KG > ClinGen-LLM > Best BSL` (at `100%` data proportion).
- **Data Proportion Impact:**
All models improve performance as data proportion increases, with diminishing returns observed in later increments (e.g., `50%` to `100%`).
## Critical Notes
- The `510%` x-axis value is inconsistent with typical percentage scales (0–100%) and may represent an error or specialized context.
- `Ground Truth` serves as the benchmark, with all models falling short of its performance.
- `ClinGen-KG` and `ClinGen-LLM` show closer performance gaps compared to `Best BSL`, suggesting potential for optimization in the latter.
## Transcribed Text
- Axis Labels: `F1-Score`, `Proportion (%) of Data`
- Legend Entries:
- `Best BSL` (Blue)
- `ClinGen-KG` (Red)
- `ClinGen-LLM` (Green)
- `Ground Truth` (Purple)
- X-Axis Values: `510`, `20`, `50`, `100`
- Y-Axis Range: `40` to `100` (increments of `10`).