## Line Graph: Entropy vs. NLL on CIFAR-100
### Overview
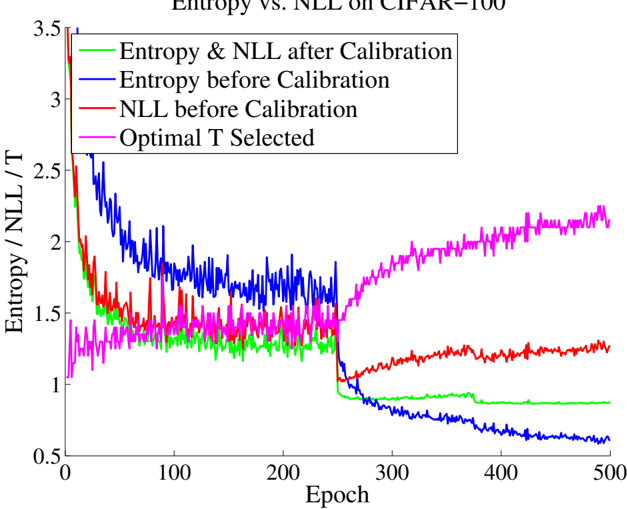
The graph illustrates the relationship between entropy, negative log-likelihood (NLL), and optimal temperature (T) across 500 training epochs on the CIFAR-100 dataset. Four data series are plotted, showing changes before and after calibration, along with the selected optimal temperature.
### Components/Axes
- **X-axis (Epoch)**: Ranges from 0 to 500 in increments of 100.
- **Y-axis (Entropy / NLL / T)**: Scaled from 0.5 to 3.5.
- **Legend**: Located in the top-left corner, with four entries:
- **Green**: Entropy & NLL after Calibration
- **Blue**: Entropy before Calibration
- **Red**: NLL before Calibration
- **Magenta**: Optimal T Selected
### Detailed Analysis
1. **Blue Line (Entropy before Calibration)**:
- Starts at ~3.5 at epoch 0, sharply declines to ~2.0 by epoch 100, then stabilizes around 1.2 by epoch 300, and further decreases to ~0.8 by epoch 500.
- Trend: Steep initial drop followed by gradual stabilization.
2. **Red Line (NLL before Calibration)**:
- Begins at ~3.2 at epoch 0, decreases to ~1.8 by epoch 100, stabilizes near 1.1 by epoch 300, and remains flat at ~1.0 by epoch 500.
- Trend: Slightly less steep decline than the blue line, with a plateau phase.
3. **Green Line (Entropy & NLL after Calibration)**:
- Starts at ~3.0 at epoch 0, drops to ~1.5 by epoch 100, stabilizes at ~1.0 by epoch 300, and remains constant at ~1.0 by epoch 500.
- Trend: Sharp initial decline, then rapid stabilization.
4. **Magenta Line (Optimal T Selected)**:
- Begins at ~1.2 at epoch 0, rises to ~1.5 by epoch 100, increases to ~1.8 by epoch 300, and peaks at ~2.2 by epoch 500.
- Trend: Gradual upward trajectory with no plateau.
### Key Observations
- **Calibration Impact**: The green line (post-calibration) consistently shows lower entropy and NLL values compared to the blue and red lines (pre-calibration), indicating improved model performance after calibration.
- **Optimal T Dynamics**: The magenta line’s steady increase suggests that the optimal temperature parameter is adjusted upward over time, possibly to balance exploration and exploitation in the model.
- **Stabilization**: All lines except the magenta line stabilize after ~300 epochs, implying convergence of the model’s metrics.
### Interpretation
The data demonstrates that calibration significantly reduces entropy and NLL, enhancing model reliability. The Optimal T’s upward trend may reflect adaptive tuning to maintain performance as the model evolves. The stabilization of entropy and NLL post-calibration suggests that the model reaches a steady state, while the rising Optimal T indicates ongoing parameter adjustments to optimize outcomes. This aligns with techniques in machine learning where calibration and temperature scaling are used to improve generalization and confidence calibration.