## Chart: Cross Sections of J
### Overview
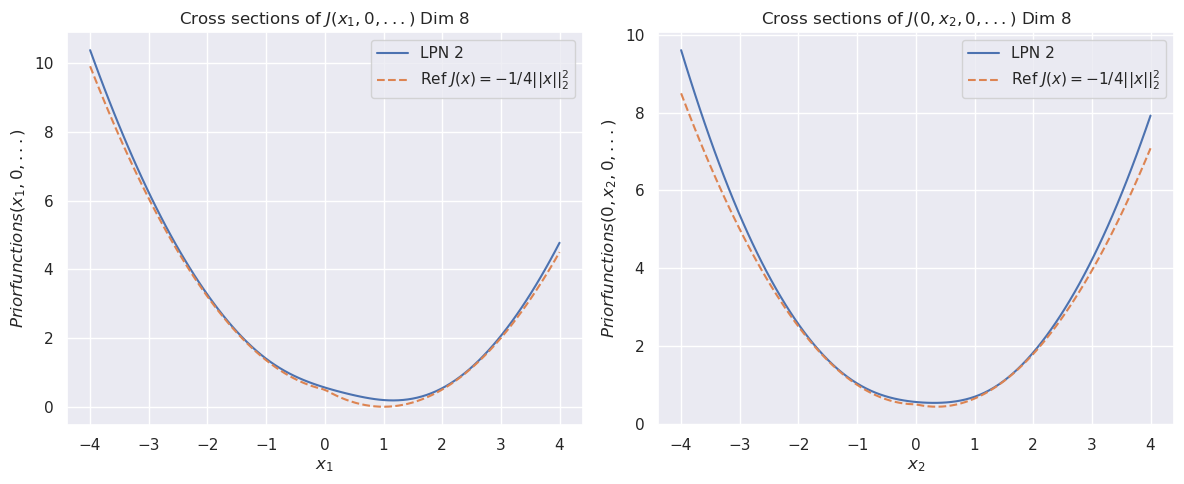
The image contains two line charts displaying cross-sections of a function J in 8 dimensions. The left chart shows the cross-section with respect to x1, while the right chart shows the cross-section with respect to x2. Each chart plots two functions: "LPN 2" and "Ref J(x) = -1/4||x||_2". Both charts exhibit a parabolic shape, indicating a quadratic relationship.
### Components/Axes
**Left Chart:**
* **Title:** Cross sections of J(x1, 0, ...) Dim 8
* **X-axis:** x1, ranging from -4 to 4 in increments of 1.
* **Y-axis:** Priorfunctions(x1, 0, ...), ranging from 0 to 10 in increments of 2.
* **Legend:** Located in the top-right corner.
* LPN 2 (solid blue line)
* Ref J(x) = -1/4||x||_2 (dashed brown line)
**Right Chart:**
* **Title:** Cross sections of J(0, x2, 0, ...) Dim 8
* **X-axis:** x2, ranging from -4 to 4 in increments of 1.
* **Y-axis:** Priorfunctions(0, x2, 0, ...), ranging from 0 to 10 in increments of 2.
* **Legend:** Located in the top-right corner.
* LPN 2 (solid blue line)
* Ref J(x) = -1/4||x||_2 (dashed brown line)
### Detailed Analysis
**Left Chart (x1):**
* **LPN 2 (blue line):** The line forms a parabola.
* At x1 = -4, Priorfunctions(x1, 0, ...) ≈ 10.5
* At x1 = 0, Priorfunctions(x1, 0, ...) ≈ 0.1
* At x1 = 4, Priorfunctions(x1, 0, ...) ≈ 5
* **Ref J(x) = -1/4||x||_2 (dashed brown line):** The line forms a parabola.
* At x1 = -4, Priorfunctions(x1, 0, ...) ≈ 9.8
* At x1 = 0, Priorfunctions(x1, 0, ...) ≈ 0.1
* At x1 = 4, Priorfunctions(x1, 0, ...) ≈ 4.1
**Right Chart (x2):**
* **LPN 2 (blue line):** The line forms a parabola.
* At x2 = -4, Priorfunctions(0, x2, 0, ...) ≈ 9.5
* At x2 = 0, Priorfunctions(0, x2, 0, ...) ≈ 0.1
* At x2 = 4, Priorfunctions(0, x2, 0, ...) ≈ 8
* **Ref J(x) = -1/4||x||_2 (dashed brown line):** The line forms a parabola.
* At x2 = -4, Priorfunctions(0, x2, 0, ...) ≈ 8.5
* At x2 = 0, Priorfunctions(0, x2, 0, ...) ≈ 0.1
* At x2 = 4, Priorfunctions(0, x2, 0, ...) ≈ 7.5
### Key Observations
* Both charts show similar parabolic trends for LPN 2 and Ref J(x).
* The minimum value for both functions in both charts occurs near x1 = 0 and x2 = 0, respectively.
* The LPN 2 function generally has slightly higher values than the Ref J(x) function, especially at the extremes of x1 and x2.
### Interpretation
The charts compare the cross-sections of the LPN 2 function with a reference function Ref J(x). The similarity in shape and values suggests that LPN 2 approximates the reference function, particularly in the region around x1 = 0 and x2 = 0. The slight differences at the extremes indicate that LPN 2 might deviate from the reference function as the input values increase in magnitude. The plots demonstrate the behavior of these functions in a high-dimensional space by visualizing their cross-sections along specific axes.