## Chart: Cross Sections of Function J
### Overview
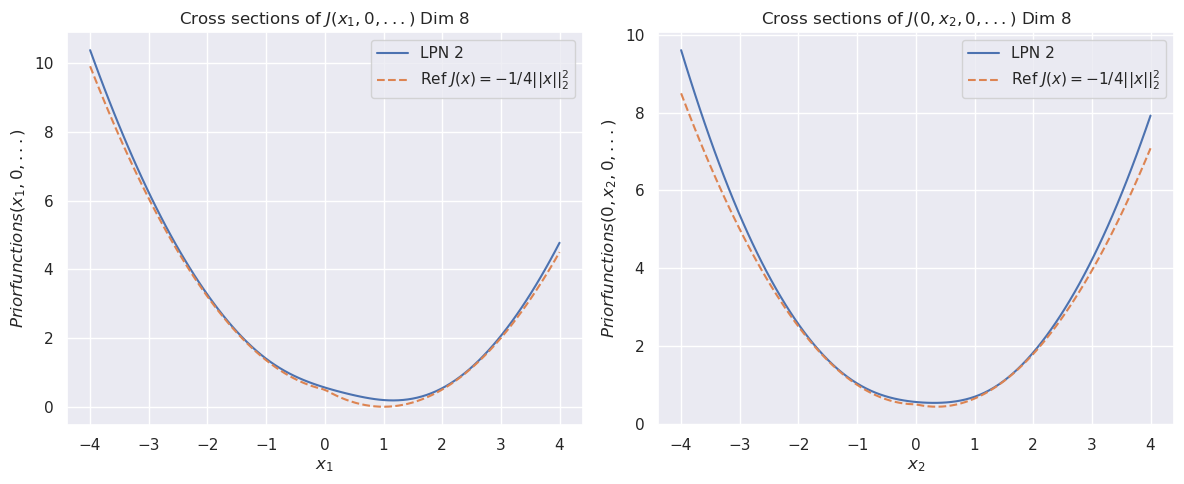
The image presents two charts, side-by-side, visualizing cross-sections of a function J with dimensionality 8. Both charts depict the relationship between a variable (x1 in the left chart, x2 in the right chart) and the "Prior functions(x1, 0, ...)" or "Prior functions(0, x2, 0, ...)" respectively. Two curves are plotted on each chart: one representing "LPN 2" and the other representing "Ref f(x) = -1/4 ||x||₂".
### Components/Axes
Each chart shares the following components:
* **Title:** "Cross sections of J(x1, 0, ... ) Dim 8" (left chart) and "Cross sections of J(0, x2, 0, ... ) Dim 8" (right chart).
* **X-axis:** Labeled "x1" (left chart) and "x2" (right chart), ranging from approximately -4 to 4.
* **Y-axis:** Labeled "Prior functions(x1, 0, ... )" (left chart) and "Prior functions(0, x2, 0, ... )" (right chart), ranging from 0 to 10.
* **Legend:** Located in the top-right corner of each chart.
* "LPN 2" - represented by a solid purple line.
* "Ref f(x) = -1/4 ||x||₂" - represented by a dashed orange line.
### Detailed Analysis
**Left Chart (x1):**
The solid purple line ("LPN 2") exhibits a U-shaped curve, reaching a minimum value around x1 = 0. The curve starts at approximately y = 9.5 at x1 = -4, decreases to a minimum of approximately y = 0.2 at x1 = 0, and then increases again to approximately y = 9.5 at x1 = 4.
The dashed orange line ("Ref f(x) = -1/4 ||x||₂") also forms a U-shaped curve, but is more symmetrical and has a shallower slope. It starts at approximately y = 10 at x1 = -4, decreases to a minimum of approximately y = 0 at x1 = 0, and increases to approximately y = 10 at x1 = 4.
**Right Chart (x2):**
The solid purple line ("LPN 2") mirrors the shape of the left chart's "LPN 2" curve. It starts at approximately y = 9.5 at x2 = -4, decreases to a minimum of approximately y = 0.2 at x2 = 0, and increases to approximately y = 9.5 at x2 = 4.
The dashed orange line ("Ref f(x) = -1/4 ||x||₂") also mirrors the shape of the left chart's "Ref f(x)" curve. It starts at approximately y = 10 at x2 = -4, decreases to a minimum of approximately y = 0 at x2 = 0, and increases to approximately y = 10 at x2 = 4.
### Key Observations
* Both charts show that both "LPN 2" and "Ref f(x)" have a minimum value at x = 0.
* The "LPN 2" curve is significantly higher than the "Ref f(x)" curve for values of x away from 0.
* The "Ref f(x)" curve is more symmetrical around x = 0 than the "LPN 2" curve.
* The shapes of the curves are very similar in both charts, suggesting a consistent relationship between the variable (x1 or x2) and the prior function.
### Interpretation
The charts demonstrate the cross-sectional behavior of a function J in two dimensions (varying x1 and x2 while holding other dimensions constant at 0). The "Ref f(x) = -1/4 ||x||₂" function serves as a reference, likely representing a standard or baseline function. The "LPN 2" function represents a different approach or model.
The U-shaped curves indicate that both functions have a minimum value at the origin (x=0). However, the "LPN 2" function exhibits larger values for non-zero x, suggesting a stronger prior or penalty for deviations from the origin. The difference in shape between the two curves suggests that "LPN 2" may be a more complex or regularized function compared to the reference function.
The fact that the patterns are consistent across both charts (x1 and x2) suggests that the behavior of the function J is similar along these cross-sections. This could indicate that the function is relatively well-behaved or that the chosen dimensions (x1 and x2) are particularly important.