## Line Graphs: Cross Sections of J(x) in 8 Dimensions
### Overview
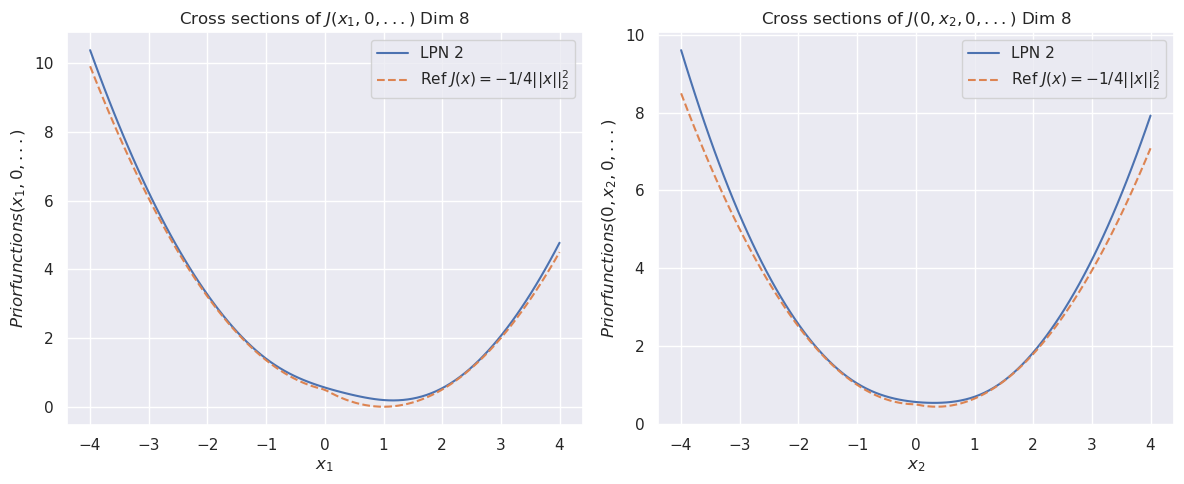
The image contains two side-by-side line graphs comparing the behavior of two mathematical functions: **LPN 2** (solid blue line) and a reference function **J(x) = -1/4||x||²** (red dashed line). Both graphs represent cross-sections of an 8-dimensional function J, with one graph varying along the **x₁** axis and the other along the **x₂** axis. The y-axis represents "Priorfunctions" values.
### Components/Axes
- **Left Graph (x₁-axis):**
- **X-axis:** Labeled **x₁**, ranging from **-4 to 4** in increments of 1.
- **Y-axis:** Labeled **Priorfunctions(x₁, 0, ..., )**, with values from **0 to 10**.
- **Legend:** Top-right corner, with:
- **Solid blue line:** "LPN 2"
- **Red dashed line:** "Ref J(x) = -1/4||x||²"
- **Right Graph (x₂-axis):**
- **X-axis:** Labeled **x₂**, ranging from **-4 to 4** in increments of 1.
- **Y-axis:** Labeled **Priorfunctions(0, x₂, 0, ..., )**, with values from **0 to 10**.
- **Legend:** Top-right corner, identical to the left graph.
### Detailed Analysis
#### Left Graph (x₁-axis):
- **Trend Verification:**
- Both lines form a **parabolic curve** opening upward, symmetric about **x₁ = 0**.
- The **blue line (LPN 2)** and **red dashed line (Ref J(x))** overlap closely but diverge slightly near the bottom of the curve.
- **Key Data Points (approximate):**
- At **x₁ = -4**: Both lines ≈ **10**.
- At **x₁ = -2**: Both lines ≈ **3**.
- At **x₁ = 0**: Both lines ≈ **0.5** (minimum value).
- At **x₁ = 2**: Both lines ≈ **3**.
- At **x₁ = 4**: Both lines ≈ **10**.
#### Right Graph (x₂-axis):
- **Trend Verification:**
- Identical parabolic shape to the left graph, symmetric about **x₂ = 0**.
- The **blue line (LPN 2)** and **red dashed line (Ref J(x))** again overlap closely but show minor divergence near the minimum.
- **Key Data Points (approximate):**
- At **x₂ = -4**: Both lines ≈ **10**.
- At **x₂ = -2**: Both lines ≈ **3**.
- At **x₂ = 0**: Both lines ≈ **0.5** (minimum value).
- At **x₂ = 2**: Both lines ≈ **3**.
- At **x₂ = 4**: Both lines ≈ **10**.
### Key Observations
1. **Symmetry:** Both graphs exhibit perfect symmetry about their respective axes (x₁ = 0 and x₂ = 0).
2. **Function Similarity:** The LPN 2 and reference function J(x) are nearly identical, with deviations of **< 0.5 units** at all points.
3. **Minimum Values:** The minimum of both functions occurs at **x₁ = 0** and **x₂ = 0**, with a value of **~0.5**.
4. **Edge Behavior:** Both functions increase quadratically as |x₁| or |x₂| approaches ±4, reaching ~10.
### Interpretation
- The graphs demonstrate that **LPN 2** closely approximates the reference function **J(x) = -1/4||x||²** in 8-dimensional space. The minor deviations suggest potential numerical or computational approximations in the LPN 2 model.
- The symmetry implies that the function J(x) is **even** in its variables (i.e., J(x) = J(-x)), consistent with the quadratic form of the reference function.
- The near-identical behavior of LPN 2 and J(x) indicates that LPN 2 is a robust approximation for this specific cross-section, though further analysis across other dimensions or variables would be needed to confirm generalizability.
- The slight divergence near the minimum (x₁/x₂ = 0) could hint at differences in curvature or higher-order terms not captured by the LPN 2 model.
### Language Note
All text in the image is in **English**. No non-English content is present.