\n
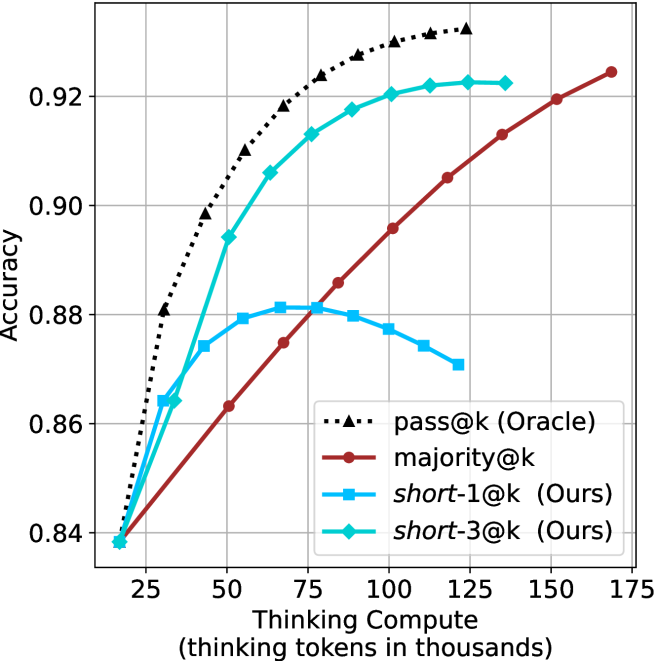
## Line Chart: Accuracy vs. Thinking Compute
### Overview
This image presents a line chart illustrating the relationship between "Thinking Compute" (measured in thousands of tokens) and "Accuracy" for several different methods. The chart compares the performance of "pass@k (Oracle)", "majority@k", "short-1@k (Ours)", and "short-3@k (Ours)".
### Components/Axes
* **X-axis:** "Thinking Compute (thinking tokens in thousands)". The scale ranges from approximately 20 to 175, with markers at 25, 50, 75, 100, 125, 150, and 175.
* **Y-axis:** "Accuracy". The scale ranges from approximately 0.84 to 0.93, with markers at 0.84, 0.86, 0.88, 0.90, and 0.92.
* **Legend:** Located in the bottom-right corner of the chart. It identifies the following data series:
* "pass@k (Oracle)" - represented by a dotted black line.
* "majority@k" - represented by a dotted purple line.
* "short-1@k (Ours)" - represented by a solid red line.
* "short-3@k (Ours)" - represented by a solid cyan line.
* **Gridlines:** A light gray grid is present to aid in reading values.
### Detailed Analysis
* **pass@k (Oracle):** This line starts at approximately 0.84 at a compute of 20, rises sharply to approximately 0.93 at a compute of 75, and then plateaus, remaining around 0.93 for the rest of the range.
* **majority@k:** This line begins at approximately 0.84 at a compute of 20, increases steadily to approximately 0.91 at a compute of 75, and then continues to increase, reaching approximately 0.925 at a compute of 175.
* **short-1@k (Ours):** This line starts at approximately 0.84 at a compute of 20, increases steadily to approximately 0.91 at a compute of 150, and then plateaus.
* **short-3@k (Ours):** This line begins at approximately 0.84 at a compute of 20, rises rapidly to approximately 0.89 at a compute of 50, then plateaus around 0.88-0.89 for the remainder of the range.
Here's a more detailed breakdown of approximate data points:
| Thinking Compute (thousands) | pass@k (Oracle) | majority@k | short-1@k (Ours) | short-3@k (Ours) |
|---|---|---|---|---|
| 25 | 0.89 | 0.87 | 0.86 | 0.87 |
| 50 | 0.92 | 0.89 | 0.88 | 0.89 |
| 75 | 0.93 | 0.91 | 0.90 | 0.88 |
| 100 | 0.93 | 0.91 | 0.91 | 0.88 |
| 125 | 0.93 | 0.91 | 0.91 | 0.87 |
| 150 | 0.93 | 0.92 | 0.91 | 0.87 |
| 175 | 0.93 | 0.925 | 0.91 | 0.87 |
### Key Observations
* "pass@k (Oracle)" achieves the highest accuracy and plateaus quickly.
* "short-3@k (Ours)" has the lowest accuracy and also plateaus quickly.
* "majority@k" and "short-1@k (Ours)" show a more gradual increase in accuracy.
* The performance gap between "pass@k (Oracle)" and the other methods widens as compute increases.
### Interpretation
The chart demonstrates the impact of "Thinking Compute" on the accuracy of different methods. "pass@k (Oracle)" benefits significantly from even a small increase in compute, quickly reaching a high level of accuracy and then stabilizing. This suggests that the "Oracle" method is highly efficient in utilizing computational resources. The "short-3@k (Ours)" method shows limited improvement with increased compute, indicating it may be constrained by its design or require significantly more compute to achieve comparable accuracy. The "majority@k" and "short-1@k (Ours)" methods fall in between, showing a more gradual improvement with increasing compute. The "Ours" designation suggests these are methods developed by the authors of the study. The data suggests that while increasing compute generally improves accuracy, the effectiveness of that increase varies significantly depending on the method used. The plateauing of the lines indicates diminishing returns – beyond a certain point, adding more compute does not yield substantial gains in accuracy.