## Line Chart: Accuracy vs. Thinking Compute for Different Methods
### Overview
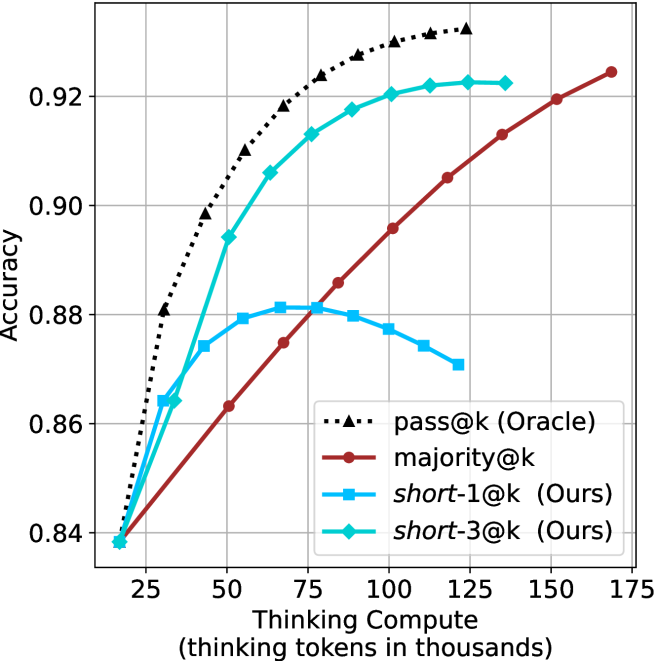
The image is a line chart comparing the performance of four different methods or models. The chart plots "Accuracy" on the vertical axis against "Thinking Compute" (measured in thousands of thinking tokens) on the horizontal axis. The primary purpose is to show how the accuracy of each method scales with increased computational resources (thinking tokens). The chart contains four distinct data series, each represented by a unique line style, color, and marker.
### Components/Axes
* **Y-Axis (Vertical):**
* **Label:** "Accuracy"
* **Scale:** Linear scale ranging from approximately 0.84 to 0.93.
* **Major Ticks:** 0.84, 0.86, 0.88, 0.90, 0.92.
* **X-Axis (Horizontal):**
* **Label:** "Thinking Compute (thinking tokens in thousands)"
* **Scale:** Linear scale ranging from approximately 20 to 175.
* **Major Ticks:** 25, 50, 75, 100, 125, 150, 175.
* **Legend:**
* **Position:** Bottom-right quadrant of the chart area.
* **Entries (from top to bottom as listed):**
1. `pass@k (Oracle)`: Represented by a black, dotted line with upward-pointing triangle markers (▲).
2. `majority@k`: Represented by a solid, dark red (maroon) line with circle markers (●).
3. `short-1@k (Ours)`: Represented by a solid, light blue (cyan) line with square markers (■).
4. `short-3@k (Ours)`: Represented by a solid, teal (blue-green) line with diamond markers (◆).
### Detailed Analysis
**1. `pass@k (Oracle)` (Black Dotted Line, ▲):**
* **Trend:** Shows a steep, concave-down increase in accuracy with compute, exhibiting strong diminishing returns. It is the highest-performing series across the entire range.
* **Approximate Data Points:**
* At ~20k tokens: Accuracy ≈ 0.84
* At 50k tokens: Accuracy ≈ 0.90
* At 75k tokens: Accuracy ≈ 0.92
* At 100k tokens: Accuracy ≈ 0.925
* At 125k tokens: Accuracy ≈ 0.928 (appears to plateau near this value).
**2. `majority@k` (Dark Red Solid Line, ●):**
* **Trend:** Shows a steady, nearly linear increase in accuracy with compute. It starts as the lowest-performing method but eventually surpasses `short-1@k`.
* **Approximate Data Points:**
* At ~20k tokens: Accuracy ≈ 0.84
* At 50k tokens: Accuracy ≈ 0.863
* At 75k tokens: Accuracy ≈ 0.885
* At 100k tokens: Accuracy ≈ 0.896
* At 125k tokens: Accuracy ≈ 0.905
* At 150k tokens: Accuracy ≈ 0.913
* At ~170k tokens: Accuracy ≈ 0.924
**3. `short-1@k (Ours)` (Light Blue Solid Line, ■):**
* **Trend:** Shows an initial increase, peaks, and then begins to decline. This suggests a potential overfitting or efficiency loss at higher compute levels for this specific method.
* **Approximate Data Points:**
* At ~20k tokens: Accuracy ≈ 0.84
* At 35k tokens: Accuracy ≈ 0.874
* At 50k tokens: Accuracy ≈ 0.879
* At 65k tokens: Accuracy ≈ 0.881 (peak)
* At 80k tokens: Accuracy ≈ 0.880
* At 100k tokens: Accuracy ≈ 0.877
* At 120k tokens: Accuracy ≈ 0.870
**4. `short-3@k (Ours)` (Teal Solid Line, ◆):**
* **Trend:** Shows a strong, concave-down increase similar to the Oracle but at a lower absolute accuracy. It consistently outperforms `short-1@k` and `majority@k` for most of the range, plateauing at higher compute.
* **Approximate Data Points:**
* At ~20k tokens: Accuracy ≈ 0.84
* At 35k tokens: Accuracy ≈ 0.864
* At 50k tokens: Accuracy ≈ 0.894
* At 65k tokens: Accuracy ≈ 0.906
* At 80k tokens: Accuracy ≈ 0.913
* At 100k tokens: Accuracy ≈ 0.920
* At 125k tokens: Accuracy ≈ 0.922
* At 140k tokens: Accuracy ≈ 0.922 (plateau).
### Key Observations
1. **Performance Hierarchy:** The Oracle (`pass@k`) sets the upper bound. Among the non-oracle methods, `short-3@k (Ours)` is the top performer for compute budgets above ~40k tokens. `majority@k` shows the most consistent scaling without degradation.
2. **Divergent Scaling:** The two "Ours" methods (`short-1@k` and `short-3@k`) exhibit fundamentally different scaling behaviors. `short-3@k` scales well, while `short-1@k` peaks and regresses, indicating that the "short-3" variant is more robust to increased compute.
3. **Crossover Point:** The `majority@k` line crosses above the `short-1@k` line at approximately 80k thinking tokens. Before this point, `short-1@k` is more accurate; after, `majority@k` is superior.
4. **Convergence at Low Compute:** All four methods start at nearly the same accuracy point (~0.84) when thinking compute is very low (~20k tokens), suggesting a common baseline performance.
### Interpretation
This chart likely comes from research on scaling inference-time compute ("thinking tokens") for language models or reasoning systems. The data suggests several key insights:
* **Value of Increased Compute:** For most methods, allocating more thinking tokens leads to higher accuracy, validating the core hypothesis that "thinking more" can improve performance.
* **Method Efficiency Matters:** The stark difference between `short-1@k` and `short-3@k` demonstrates that not all methods benefit equally from extra compute. The "short-3" approach is architecturally or algorithmically better at converting additional tokens into accuracy gains. The decline of `short-1@k` could indicate it starts generating redundant or counterproductive reasoning steps at high token counts.
* **Oracle as a Benchmark:** The `pass@k (Oracle)` line represents an idealized upper bound (perhaps using ground-truth selection). The gap between it and `short-3@k` shows the remaining potential for improvement in the proposed method.
* **Practical Trade-offs:** The choice of method depends on the available compute budget. For very low budgets (<40k tokens), the methods are similar. For medium budgets (40k-80k), `short-3@k` is best. For very high budgets where `short-3@k` plateaus, `majority@k` continues to improve slowly and might eventually catch up, though it requires significantly more tokens to reach the same accuracy level that `short-3@k` achieves earlier.
The chart effectively argues for the superiority of the `short-3@k (Ours)` method in the mid-to-high compute regime, while honestly showing the limitations of its `short-1@k` counterpart.