## Line Chart: Model Accuracy vs. Thinking Compute
### Overview
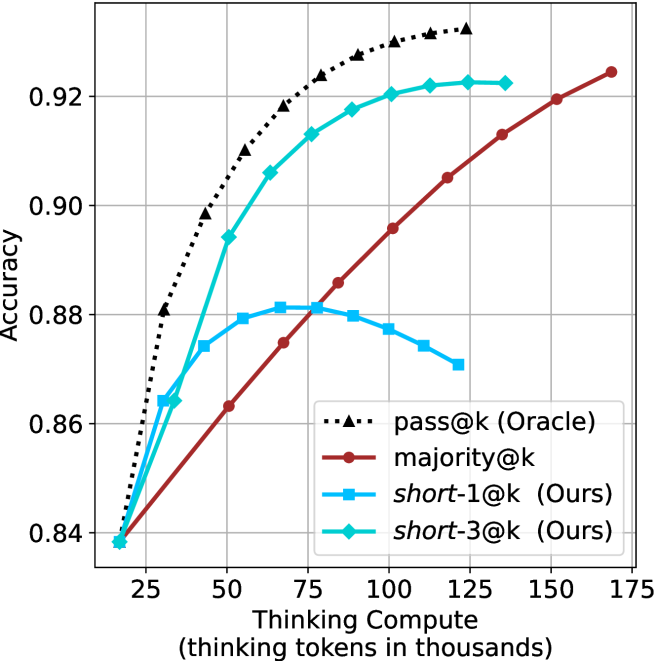
The chart compares the accuracy of four different models (pass@k, majority@k, short-1@k, short-3@k) across varying levels of thinking compute (measured in thousands of tokens). Accuracy is plotted on the y-axis (0.84–0.92), while thinking compute is on the x-axis (25–175k tokens). The Oracle (pass@k) serves as the benchmark, with other models showing varying performance trends.
### Components/Axes
- **X-axis**: Thinking Compute (thinking tokens in thousands) – Range: 25 to 175k
- **Y-axis**: Accuracy – Range: 0.84 to 0.92
- **Legend**: Located in the bottom-right corner, with four entries:
- **pass@k (Oracle)**: Dashed line with triangle markers (black)
- **majority@k**: Solid red line with circle markers
- **short-1@k (Ours)**: Solid blue line with square markers
- **short-3@k (Ours)**: Solid green line with diamond markers
### Detailed Analysis
1. **pass@k (Oracle)**:
- Starts at 0.84 accuracy at 25k tokens.
- Increases steadily to 0.92 accuracy at 175k tokens.
- Linear upward trend with no plateaus.
2. **majority@k**:
- Begins at 0.84 accuracy at 25k tokens.
- Slower, gradual increase compared to Oracle.
- Reaches 0.92 accuracy at 150k tokens.
- Linear upward trend but lags behind Oracle.
3. **short-1@k (Ours)**:
- Starts at 0.84 accuracy at 25k tokens.
- Peaks at 0.88 accuracy around 75k tokens.
- Declines slightly to 0.87 accuracy at 175k tokens.
- Non-linear: Rises sharply, then plateaus/declines.
4. **short-3@k (Ours)**:
- Starts at 0.84 accuracy at 25k tokens.
- Peaks at 0.92 accuracy around 100k tokens.
- Plateaus at 0.92 accuracy from 100k to 175k tokens.
- Non-linear: Rapid rise followed by stabilization.
### Key Observations
- **Oracle Dominance**: The pass@k (Oracle) consistently outperforms all other models across all compute levels.
- **majority@k Trade-off**: Requires significantly more compute (150k tokens) to match Oracle’s 175k-token performance.
- **short-1@k Efficiency**: Achieves moderate accuracy (0.88) with fewer tokens (75k) but degrades at higher compute.
- **short-3@k Efficiency**: Matches Oracle’s accuracy (0.92) at 100k tokens but plateaus, suggesting diminishing returns beyond this point.
### Interpretation
The chart highlights the relationship between compute efficiency and accuracy for different models. The Oracle (pass@k) represents the ideal performance, while majority@k demonstrates a compute-heavy approach. The short-1@k and short-3@k models (labeled "Ours") show trade-offs: short-1@k sacrifices accuracy at higher compute, while short-3@k achieves Oracle-level accuracy at 100k tokens but offers no further gains. This suggests that optimizing compute allocation is critical for balancing efficiency and performance, with short-3@k potentially offering the best cost-accuracy ratio up to 100k tokens. The Oracle’s linear scalability underscores the theoretical upper bound for these models.