## Bar Charts: Accuracy Comparison of Different Models
### Overview
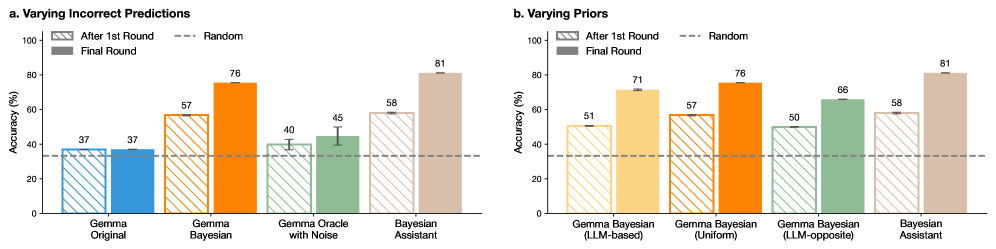
The image presents two bar charts comparing the accuracy of different models under varying conditions. Chart 'a' focuses on varying incorrect predictions, while chart 'b' explores varying priors. Each chart displays the accuracy (%) of different models "After 1st Round" (represented by hatched bars) and in the "Final Round" (represented by solid bars). A dashed horizontal line indicates the "Random" accuracy level.
### Components/Axes
**Chart a. Varying Incorrect Predictions:**
* **Title:** Varying Incorrect Predictions
* **Y-axis:** Accuracy (%), with a scale from 0 to 100 in increments of 20.
* **X-axis:** Categorical, representing different models:
* Gemma Original
* Gemma Bayesian
* Gemma Oracle with Noise
* Bayesian Assistant
* **Legend:** Located at the top-left of the chart.
* "After 1st Round": Represented by hatched bars.
* "Final Round": Represented by solid bars.
* "Random": Represented by a dashed horizontal line.
**Chart b. Varying Priors:**
* **Title:** Varying Priors
* **Y-axis:** Accuracy (%), with a scale from 0 to 100 in increments of 20.
* **X-axis:** Categorical, representing different models:
* Gemma Bayesian (LLM-based)
* Gemma Bayesian (Uniform)
* Gemma Bayesian (LLM-opposite)
* Bayesian Assistant
* **Legend:** Located at the top-left of the chart.
* "After 1st Round": Represented by hatched bars.
* "Final Round": Represented by solid bars.
* "Random": Represented by a dashed horizontal line.
### Detailed Analysis
**Chart a. Varying Incorrect Predictions:**
* **Gemma Original:**
* After 1st Round: Accuracy is approximately 37%.
* Final Round: Accuracy is approximately 37%.
* **Gemma Bayesian:**
* After 1st Round: Accuracy is approximately 57%.
* Final Round: Accuracy is approximately 76%.
* **Gemma Oracle with Noise:**
* After 1st Round: Accuracy is approximately 40%.
* Final Round: Accuracy is approximately 45%.
* **Bayesian Assistant:**
* After 1st Round: Accuracy is approximately 58%.
* Final Round: Accuracy is approximately 81%.
* **Random Accuracy:** Approximately 33%, represented by the dashed horizontal line.
**Chart b. Varying Priors:**
* **Gemma Bayesian (LLM-based):**
* After 1st Round: Accuracy is approximately 51%.
* Final Round: Accuracy is approximately 71%.
* **Gemma Bayesian (Uniform):**
* After 1st Round: Accuracy is approximately 57%.
* Final Round: Accuracy is approximately 76%.
* **Gemma Bayesian (LLM-opposite):**
* After 1st Round: Accuracy is approximately 50%.
* Final Round: Accuracy is approximately 66%.
* **Bayesian Assistant:**
* After 1st Round: Accuracy is approximately 58%.
* Final Round: Accuracy is approximately 81%.
* **Random Accuracy:** Approximately 33%, represented by the dashed horizontal line.
### Key Observations
* In both charts, the "Bayesian Assistant" model consistently achieves the highest accuracy in the "Final Round."
* The "Final Round" accuracy is generally higher than the "After 1st Round" accuracy for most models in both charts, indicating an improvement in performance over time.
* The "Gemma Original" model in chart 'a' shows no improvement between the "After 1st Round" and "Final Round."
* The "Random" accuracy line serves as a baseline, and most models significantly outperform this baseline in the "Final Round."
### Interpretation
The data suggests that incorporating Bayesian methods, particularly with the "Bayesian Assistant," leads to higher accuracy in these models. The improvement from "After 1st Round" to "Final Round" indicates that the models are learning and refining their predictions over time. The "Bayesian Assistant" consistently outperforming other models suggests that its approach to handling incorrect predictions or prior information is more effective. The "Gemma Original" model's lack of improvement in chart 'a' may indicate a limitation in its design or training process. The charts highlight the importance of model selection and the impact of different strategies for handling uncertainty and prior knowledge in achieving higher accuracy.