## Flow Diagram: Math Problem Solving Steps
### Overview
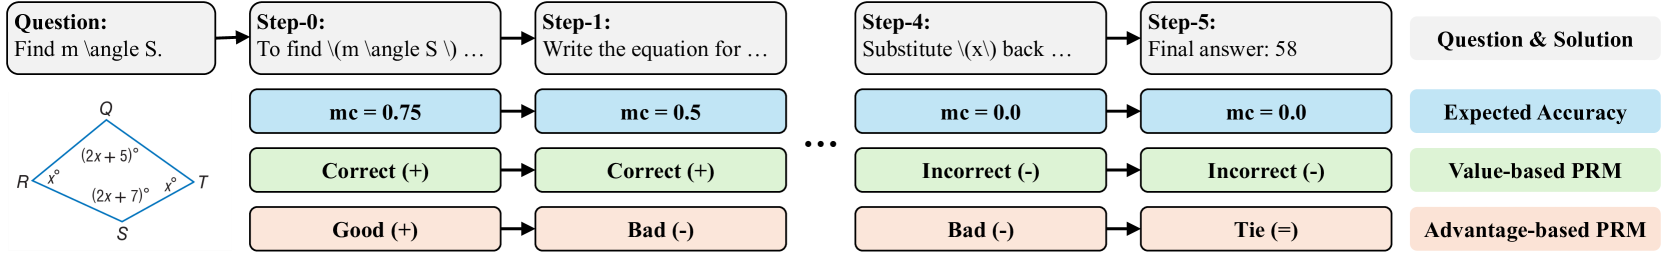
The image is a flow diagram illustrating the steps to solve a geometry problem, specifically finding the measure of angle S in a quadrilateral. It shows the progression of steps, the expected accuracy (mc), and the performance of two different problem-solving methods: Value-based PRM and Advantage-based PRM.
### Components/Axes
* **Nodes:** Rectangular boxes representing steps, accuracy, and performance.
* **Arrows:** Indicate the flow of the problem-solving process.
* **Text Labels:** Describe the steps, accuracy values, and performance assessments.
* **Geometric Diagram:** A quadrilateral labeled with angle measures.
* **Legend (Right Side):**
* Question & Solution (Grey)
* Expected Accuracy (Light Blue)
* Value-based PRM (Light Green)
* Advantage-based PRM (Light Orange)
### Detailed Analysis or ### Content Details
**1. Question & Initial Diagram (Top-Left):**
* **Question:** "Find m ∠S."
* **Diagram:** A quadrilateral labeled Q, R, S, and T.
* ∠Q = (2x + 5)°
* ∠R = x°
* ∠T = x°
* ∠S = (2x + 7)°
**2. Step-by-Step Solution (Top Row):**
* **Step-0:** "To find \(m \angle S \) ..."
* **Step-1:** "Write the equation for ..."
* **Step-4:** "Substitute \(x\) back ..."
* **Step-5:** "Final answer: 58"
**3. Expected Accuracy (Second Row):**
* **Step-0:** mc = 0.75
* **Step-1:** mc = 0.5
* **Step-4:** mc = 0.0
* **Step-5:** mc = 0.0
**4. Value-based PRM Performance (Third Row):**
* **Step-0:** Correct (+)
* **Step-1:** Correct (+)
* **Step-4:** Incorrect (-)
* **Step-5:** Incorrect (-)
**5. Advantage-based PRM Performance (Bottom Row):**
* **Step-0:** Good (+)
* **Step-1:** Bad (-)
* **Step-4:** Bad (-)
* **Step-5:** Tie (=)
**6. Ellipsis:**
* There is an ellipsis (...) between Step-1 and Step-4, indicating that some steps are omitted for brevity.
### Key Observations
* The expected accuracy (mc) decreases as the problem progresses, reaching 0.0 in the final steps.
* The Value-based PRM starts with correct steps but ends with incorrect steps.
* The Advantage-based PRM starts with a good step but degrades to a tie in the final step.
### Interpretation
The diagram illustrates a problem-solving process for a geometry question, highlighting the performance of two different methods (Value-based PRM and Advantage-based PRM) at each step. The decreasing expected accuracy suggests that the problem becomes more complex or error-prone as it progresses. The performance of the two methods varies, indicating that their effectiveness depends on the specific step in the problem-solving process. The ellipsis indicates that the diagram is simplified and does not show all the intermediate steps.