TECHNICAL ASSET FINGERPRINT
be09e494eca279f62ef36c27
Click to view fullscreen
Press ESC or click to close
FOUND IN PAPERS
EXPERT: healer-alpha-free VERSION 1
RUNTIME: free/openrouter/healer-alpha
INTEL_VERIFIED
## Diagram: Multi-Step Problem Solving Process with Evaluation Metrics
### Overview
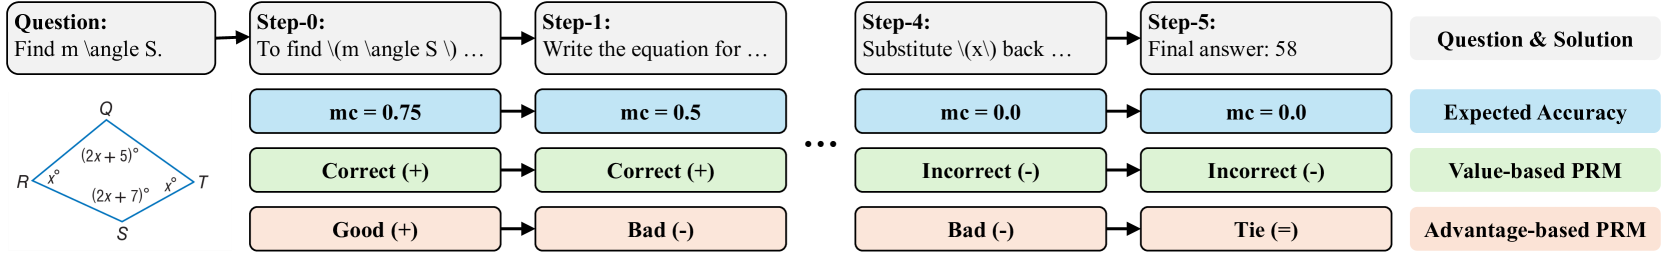
The image is a flowchart diagram illustrating a multi-step problem-solving process for a geometry question. It visually maps the progression from an initial question through several solution steps, with each step being evaluated by three distinct metrics: Expected Accuracy, Value-based PRM (Process Reward Model), and Advantage-based PRM. The diagram demonstrates how evaluation scores and correctness assessments can change across the solution trajectory.
### Components/Axes
The diagram is organized into a horizontal flow from left to right, with vertical stacking of evaluation metrics for each step.
**1. Problem & Solution Flow (Top Row - White Boxes):**
* **Question Box (Far Left):** Contains the text "Question: Find m∠S."
* **Step-0 Box:** "Step-0: To find \(m\angle S\) ..."
* **Step-1 Box:** "Step-1: Write the equation for ..."
* **Ellipsis (...):** Indicates omitted intermediate steps (Step-2, Step-3).
* **Step-4 Box:** "Step-4: Substitute \(x\) back ..."
* **Step-5 Box:** "Step-5: Final answer: 58"
* **Legend Box (Far Right):** "Question & Solution"
**2. Geometry Diagram (Below Question Box):**
A quadrilateral labeled with vertices Q (top), R (left), S (bottom), T (right). The interior angles are given as expressions:
* Angle at R: \(x^\circ\)
* Angle at Q: \((2x + 5)^\circ\)
* Angle at T: \(x^\circ\)
* Angle at S: \((2x + 7)^\circ\)
**3. Evaluation Metrics (Three Rows Below Solution Steps):**
Each step in the solution flow has a corresponding column of three colored boxes below it, representing different evaluation metrics.
* **Row 1 - Expected Accuracy (Light Blue Boxes):**
* Legend (Right): "Expected Accuracy"
* Values per step: `mc = 0.75` (Step-0), `mc = 0.5` (Step-1), `mc = 0.0` (Step-4), `mc = 0.0` (Step-5).
* **Row 2 - Value-based PRM (Light Green Boxes):**
* Legend (Right): "Value-based PRM"
* Assessments per step: `Correct (+)` (Step-0), `Correct (+)` (Step-1), `Incorrect (-)` (Step-4), `Incorrect (-)` (Step-5).
* **Row 3 - Advantage-based PRM (Light Orange Boxes):**
* Legend (Right): "Advantage-based PRM"
* Assessments per step: `Good (+)` (Step-0), `Bad (-)` (Step-1), `Bad (-)` (Step-4), `Tie (=)` (Step-5).
**Arrows:** Black arrows connect the boxes horizontally, indicating the flow from the Question to Step-0, Step-0 to Step-1, Step-1 to the ellipsis, the ellipsis to Step-4, and Step-4 to Step-5. Vertical alignment implies the evaluation boxes correspond to the step directly above them.
### Detailed Analysis
The diagram tracks the solution of a geometry problem where the goal is to find the measure of angle S (m∠S) in a quadrilateral with given angle expressions.
* **Problem Setup:** The quadrilateral QRST has angles defined in terms of a variable `x`. The sum of interior angles in a quadrilateral is 360°. The implied equation would be: \(x + (2x+5) + x + (2x+7) = 360\).
* **Solution Progression & Evaluation:**
* **Step-0 (Initial approach):** Evaluated with high Expected Accuracy (`mc=0.75`), marked as `Correct (+)` by Value-based PRM, and `Good (+)` by Advantage-based PRM.
* **Step-1 (Writing the equation):** Expected Accuracy drops to `mc=0.5`. It is still considered `Correct (+)` by Value-based PRM but is now rated `Bad (-)` by Advantage-based PRM, suggesting the step, while factually correct, may be suboptimal or inefficient.
* **Steps 2 & 3:** Are omitted (represented by `...`).
* **Step-4 (Substituting x back):** Expected Accuracy has fallen to `mc=0.0`. Both PRM metrics now judge the step as `Incorrect (-)` and `Bad (-)`.
* **Step-5 (Final answer):** The final answer is given as "58". Expected Accuracy remains `mc=0.0`. Value-based PRM still marks it `Incorrect (-)`, while Advantage-based PRM gives a `Tie (=)` assessment, possibly indicating the final answer is neither better nor worse than an alternative at this stage.
### Key Observations
1. **Diverging Metrics:** The three evaluation metrics do not always agree. For Step-1, Value-based PRM says "Correct" while Advantage-based PRM says "Bad." This highlights that a step can be technically right but poorly judged in terms of advantage or strategy.
2. **Accuracy Decay:** The "Expected Accuracy" (`mc`) metric shows a clear downward trend from 0.75 to 0.0, suggesting the model's confidence in the solution's correctness diminishes as the process continues, culminating in a final answer it deems incorrect.
3. **Error Propagation:** The diagram implies an error occurs somewhere in the omitted steps (2 or 3). This error propagates forward, causing Step-4 and Step-5 to be evaluated as incorrect by the Value-based PRM.
4. **Geometry Problem Context:** The specific geometry problem involves solving for `x` using the quadrilateral angle sum theorem. The final answer "58" likely refers to m∠S, which is \((2x+7)^\circ\). If the final answer is incorrect, the error likely occurred in solving the equation for `x`.
### Interpretation
This diagram serves as a meta-analysis of an AI or automated system's problem-solving process. It doesn't just show the solution steps; it visualizes the system's *self-evaluation* of those steps using different reward models.
* **What it demonstrates:** It illustrates how a process can start with high confidence and correct initial reasoning but still fail due to errors introduced later. The different PRM rows showcase alternative ways to judge the quality of each step—one based on the step's isolated correctness (Value-based) and another based on its strategic advantage within the whole process (Advantage-based).
* **Relationship between elements:** The horizontal flow represents the temporal sequence of solving the problem. The vertical stacks for each step provide a multi-faceted evaluation snapshot at that point in time. The geometry diagram is the concrete problem instance being processed.
* **Notable insight:** The most significant anomaly is the disconnect in Step-1 between the "Correct" and "Bad" labels. This suggests the evaluation framework can distinguish between factual accuracy and procedural quality. The final `Tie` assessment for an incorrect answer is also intriguing, possibly indicating the model's uncertainty or the presence of multiple plausible but wrong answer paths at the conclusion.
In essence, the image is a diagnostic tool for understanding not just *if* a solution fails, but *how* and *when* the failure occurs according to different evaluative lenses, using a concrete geometry problem as the test case.
DECODING INTELLIGENCE...