## Bar Chart: Model Accuracy Comparison Across Datasets
### Overview
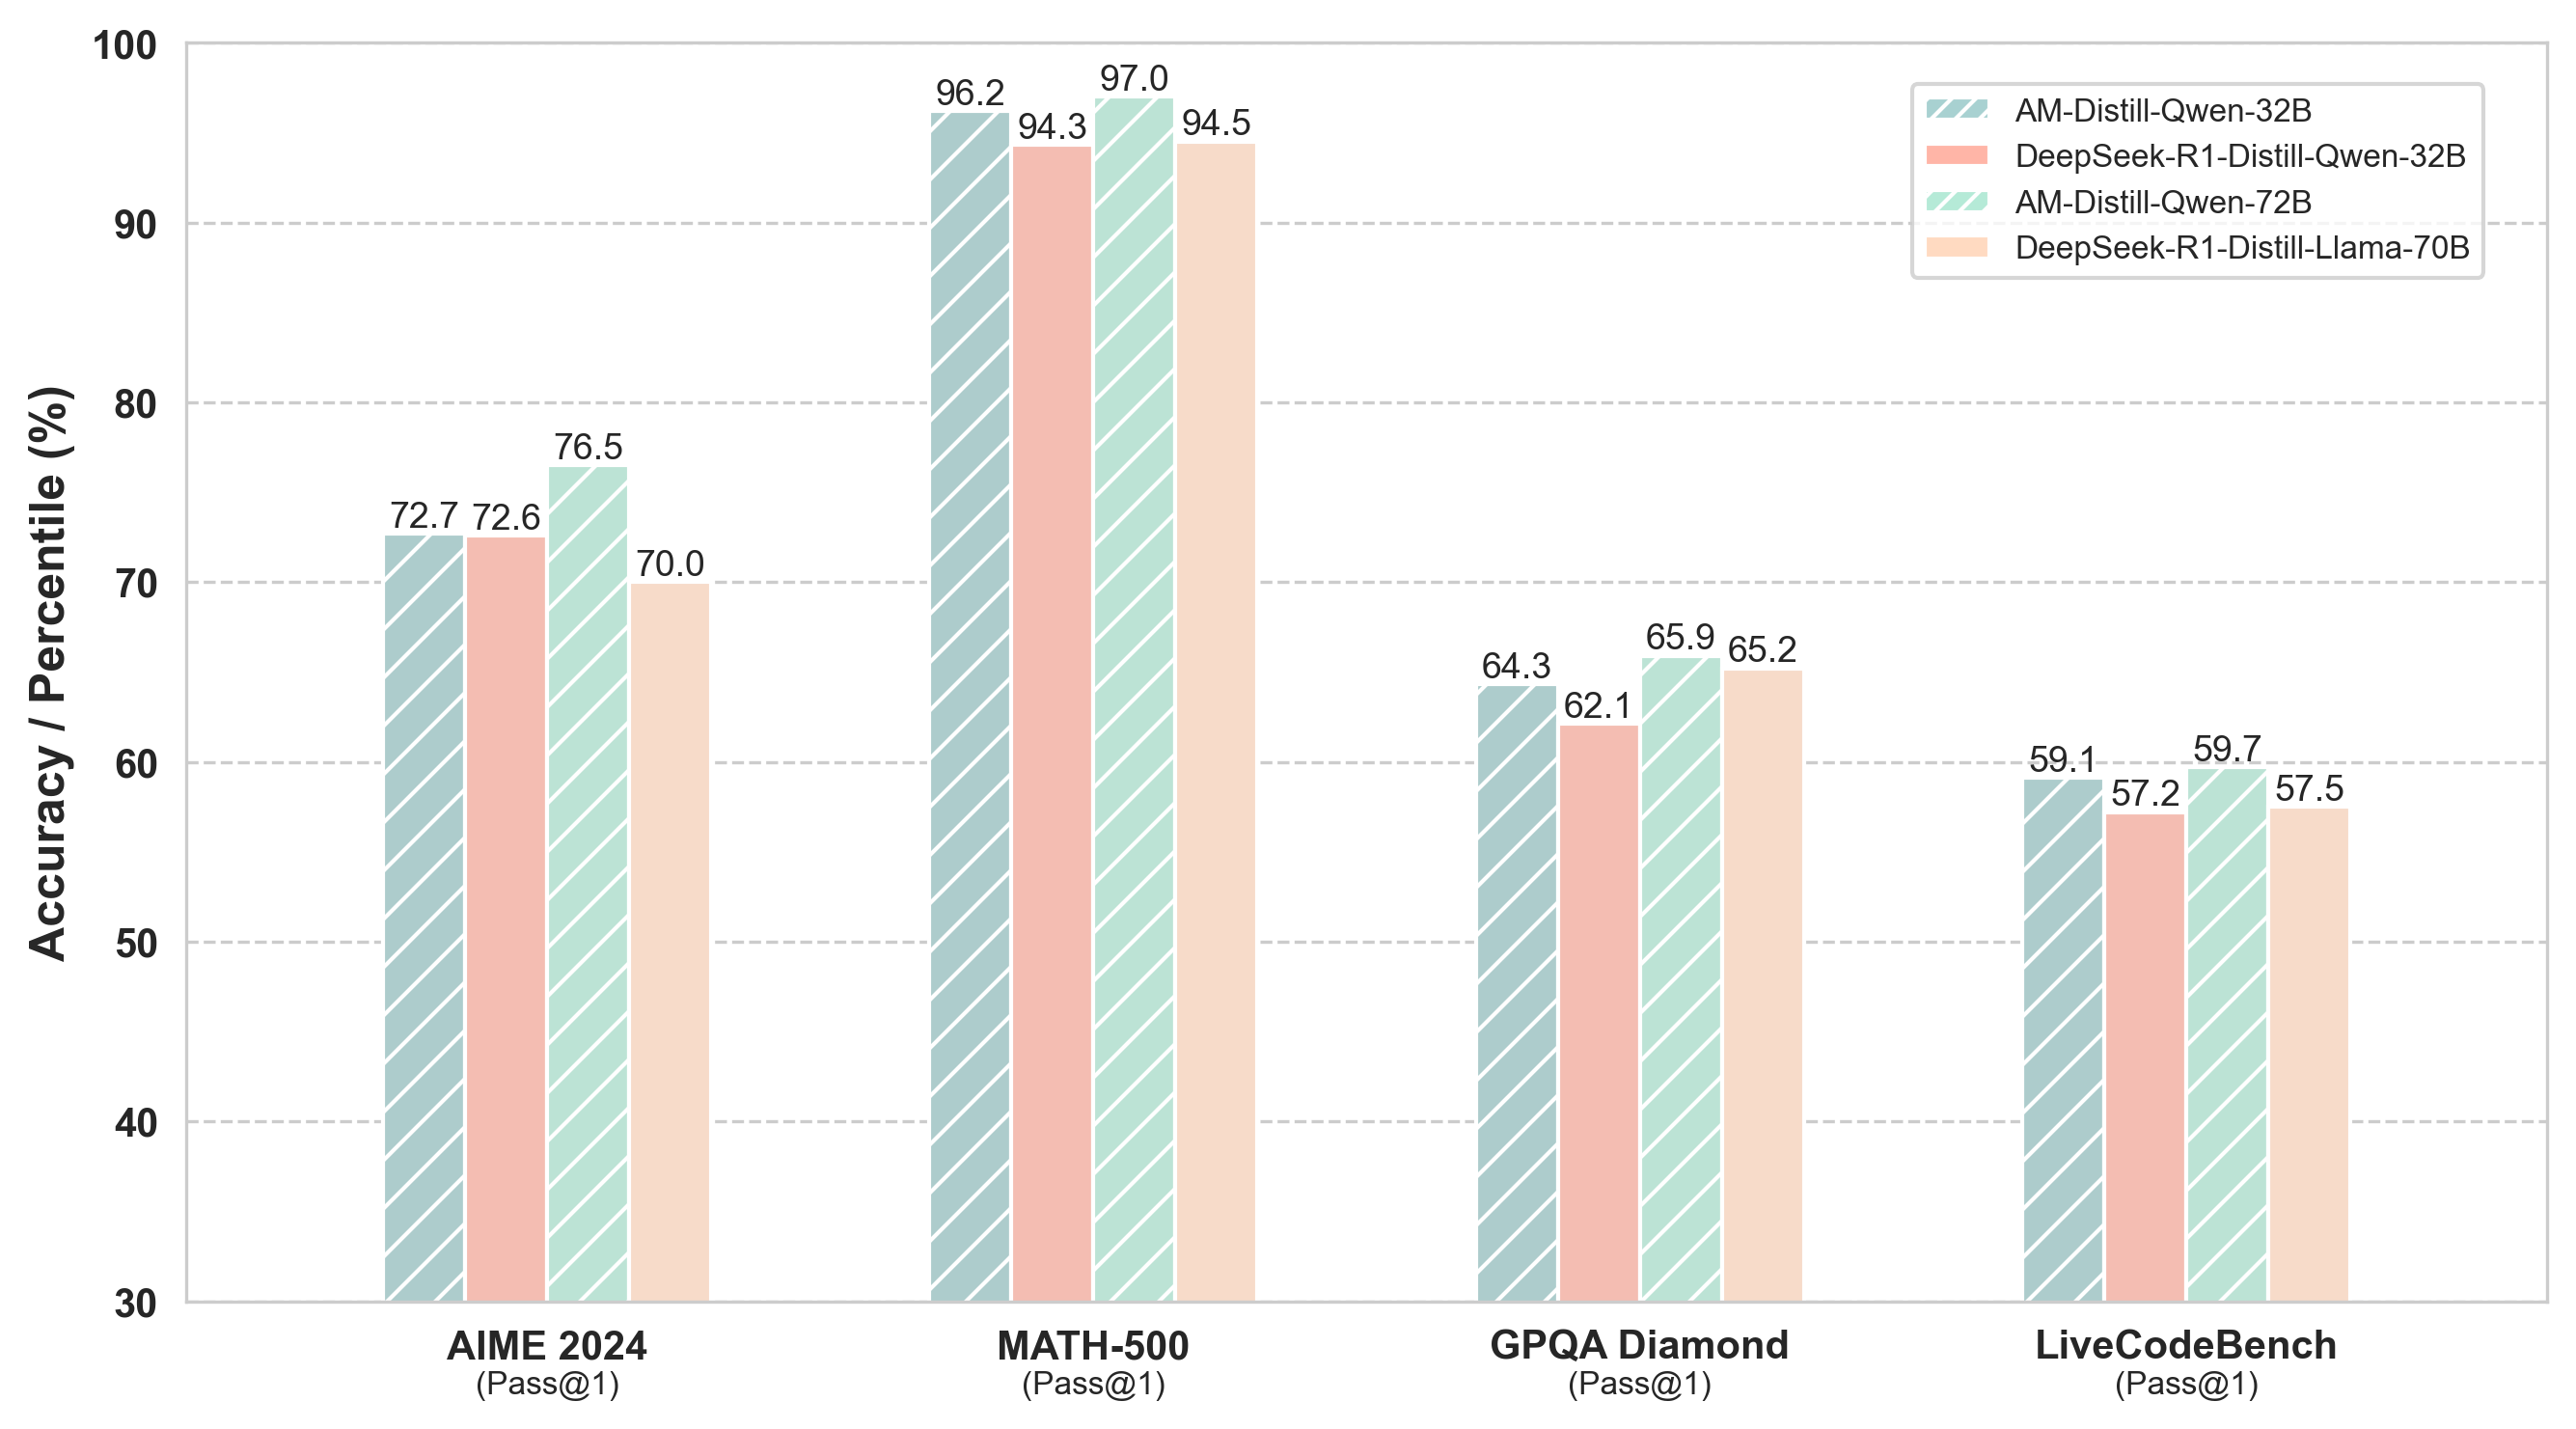
The chart compares the accuracy (Pass@1) of four AI models across four datasets: AIME 2024, MATH-500, GPQA Diamond, and LiveCodeBench. Models include AM-Distill-Qwen-32B, DeepSeek-R1-Distill-Qwen-32B, AM-Distill-Qwen-72B, and DeepSeek-R1-Distill-Llama-70B. Accuracy is measured in percentage (%) on a y-axis from 30% to 100%.
### Components/Axes
- **X-axis**: Datasets (AIME 2024, MATH-500, GPQA Diamond, LiveCodeBench).
- **Y-axis**: Accuracy (Pass@1) in percentage (%) from 30% to 100%.
- **Legend**: Located in the top-right corner, mapping colors to models:
- Blue (striped): AM-Distill-Qwen-32B
- Red (solid): DeepSeek-R1-Distill-Qwen-32B
- Green (striped): AM-Distill-Qwen-72B
- Orange (solid): DeepSeek-R1-Distill-Llama-70B
### Detailed Analysis
1. **AIME 2024**:
- AM-Distill-Qwen-32B: 72.7%
- DeepSeek-R1-Distill-Qwen-32B: 72.6%
- AM-Distill-Qwen-72B: 76.5%
- DeepSeek-R1-Distill-Llama-70B: 70.0%
2. **MATH-500**:
- AM-Distill-Qwen-32B: 96.2%
- DeepSeek-R1-Distill-Qwen-32B: 94.3%
- AM-Distill-Qwen-72B: 97.0%
- DeepSeek-R1-Distill-Llama-70B: 94.5%
3. **GPQA Diamond**:
- AM-Distill-Qwen-32B: 64.3%
- DeepSeek-R1-Distill-Qwen-32B: 62.1%
- AM-Distill-Qwen-72B: 65.9%
- DeepSeek-R1-Distill-Llama-70B: 65.2%
4. **LiveCodeBench**:
- AM-Distill-Qwen-32B: 59.1%
- DeepSeek-R1-Distill-Qwen-32B: 57.2%
- AM-Distill-Qwen-72B: 59.7%
- DeepSeek-R1-Distill-Llama-70B: 57.5%
### Key Observations
- **Highest Performance**: MATH-500 dataset shows the highest accuracies, with AM-Distill-Qwen-72B achieving 97.0%.
- **Lowest Performance**: LiveCodeBench dataset has the lowest accuracies, with DeepSeek-R1-Distill-Llama-70B at 57.5%.
- **Model Trends**:
- AM-Distill-Qwen-72B consistently outperforms other models across all datasets.
- DeepSeek-R1-Distill-Qwen-32B and DeepSeek-R1-Distill-Llama-70B show lower accuracy than their Qwen-based counterparts.
- The 72B model (AM-Distill-Qwen-72B) demonstrates superior performance compared to the 32B and 70B models.
### Interpretation
The data suggests that larger model sizes (e.g., 72B parameters) and specific architectures (e.g., AM-Distill-Qwen) yield higher accuracy. The DeepSeek-R1-Distill models, while based on Qwen, underperform compared to their non-distilled counterparts, indicating potential trade-offs in distillation processes. MATH-500’s high accuracy across models implies it is the "easiest" dataset, while LiveCodeBench’s lower scores suggest greater complexity. The AM-Distill-Qwen-72B model emerges as the most robust performer, highlighting the importance of model scale and architecture in task-specific performance.