## Bar Chart: Model Performance on Various Benchmarks
### Overview
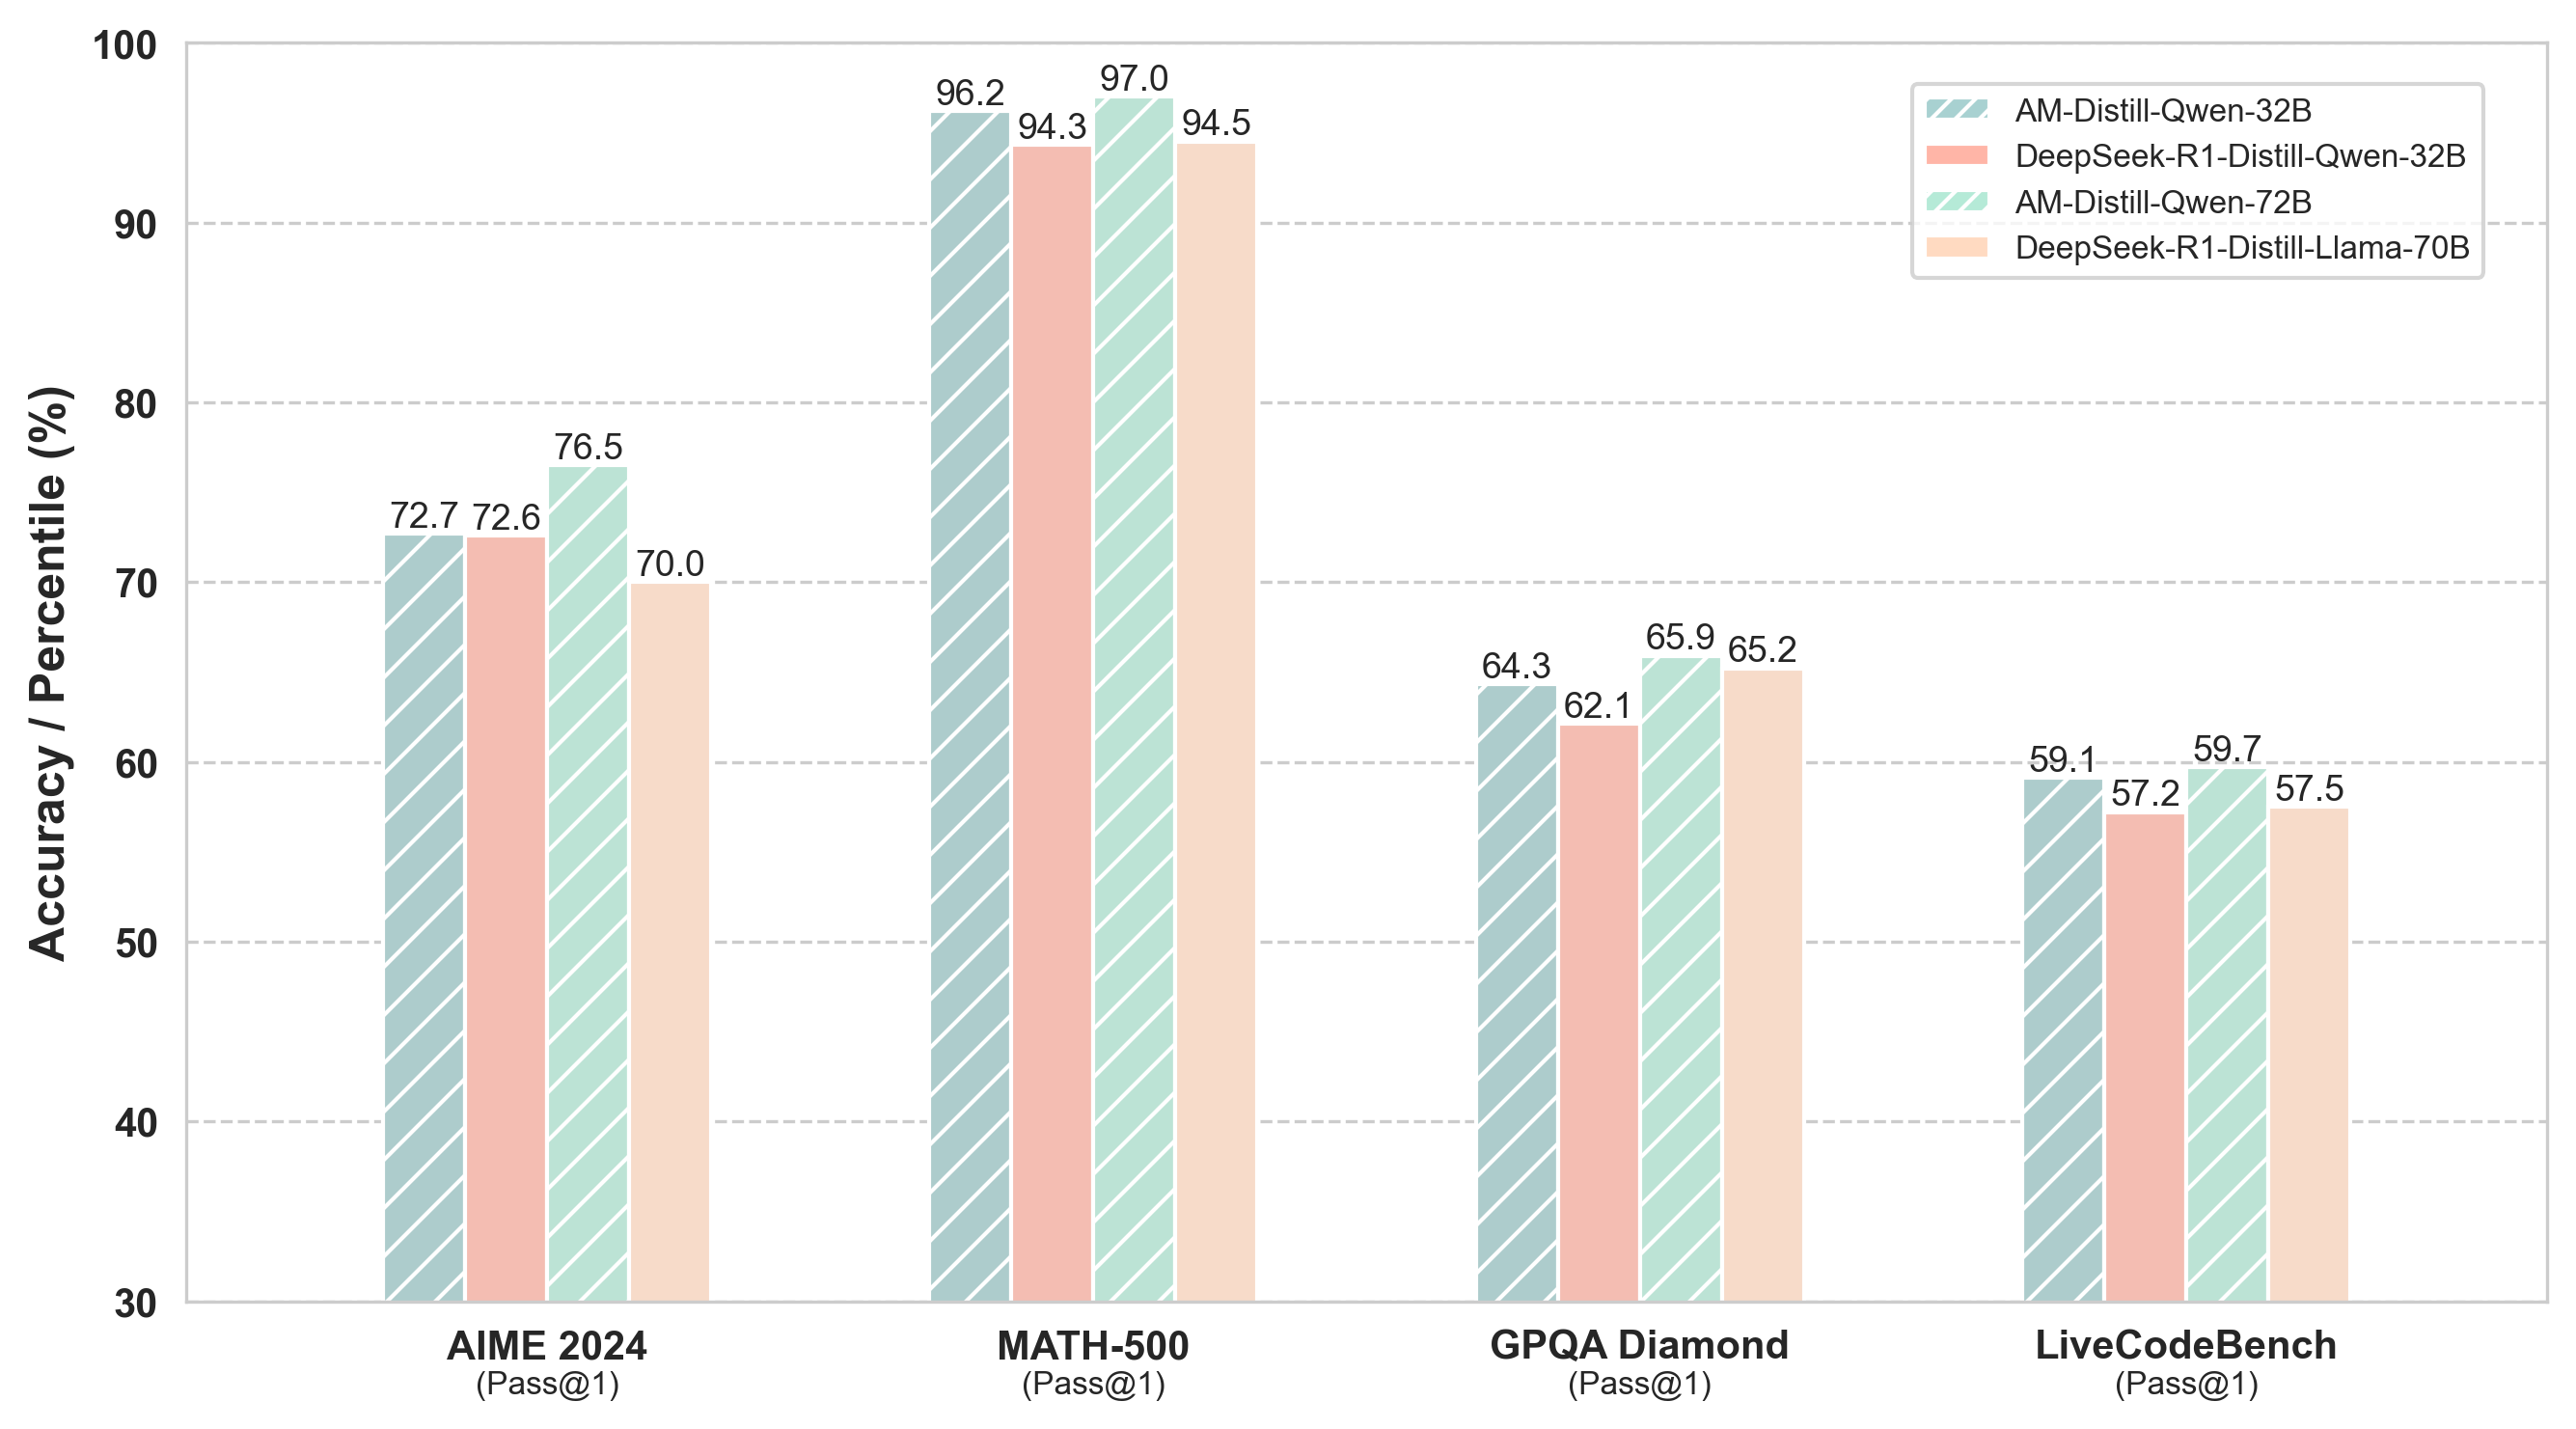
The image is a bar chart comparing the performance of four different language models on four different benchmarks: AIME 2024, MATH-500, GPQA Diamond, and LiveCodeBench. The y-axis represents Accuracy/Percentile (%), ranging from 30 to 100. The x-axis represents the benchmarks. The chart uses different colored bars to represent each model.
### Components/Axes
* **Y-axis:** Accuracy / Percentile (%)
* Scale: 30 to 100, with gridlines at intervals of 10.
* **X-axis:** Benchmarks (AIME 2024, MATH-500, GPQA Diamond, LiveCodeBench), with "(Pass@1)" below each benchmark name.
* **Legend:** Located at the top-right of the chart.
* Light Green (with diagonal lines): AM-Distill-Qwen-32B
* Light Red (with diagonal lines): DeepSeek-R1-Distill-Qwen-32B
* Light Green (with diagonal lines): AM-Distill-Qwen-72B
* Light Orange (with diagonal lines): DeepSeek-R1-Distill-Llama-70B
### Detailed Analysis
Here's a breakdown of the performance of each model on each benchmark:
* **AIME 2024 (Pass@1):**
* AM-Distill-Qwen-32B (Light Green): 72.7
* DeepSeek-R1-Distill-Qwen-32B (Light Red): 72.6
* AM-Distill-Qwen-72B (Light Green): 76.5
* DeepSeek-R1-Distill-Llama-70B (Light Orange): 70.0
* **MATH-500 (Pass@1)::**
* AM-Distill-Qwen-32B (Light Green): 96.2
* DeepSeek-R1-Distill-Qwen-32B (Light Red): 94.3
* AM-Distill-Qwen-72B (Light Green): 97.0
* DeepSeek-R1-Distill-Llama-70B (Light Orange): 94.5
* **GPQA Diamond (Pass@1):**
* AM-Distill-Qwen-32B (Light Green): 64.3
* DeepSeek-R1-Distill-Qwen-32B (Light Red): 62.1
* AM-Distill-Qwen-72B (Light Green): 65.9
* DeepSeek-R1-Distill-Llama-70B (Light Orange): 65.2
* **LiveCodeBench (Pass@1):**
* AM-Distill-Qwen-32B (Light Green): 59.1
* DeepSeek-R1-Distill-Qwen-32B (Light Red): 57.2
* AM-Distill-Qwen-72B (Light Green): 59.7
* DeepSeek-R1-Distill-Llama-70B (Light Orange): 57.5
### Key Observations
* The AM-Distill-Qwen-72B model generally performs the best across all benchmarks, achieving the highest scores in AIME 2024, MATH-500, and GPQA Diamond.
* The MATH-500 benchmark has the highest scores for all models, indicating it might be an easier task compared to the others.
* The LiveCodeBench benchmark has the lowest scores for all models, suggesting it is the most challenging task.
* The performance difference between the models is most pronounced in the AIME 2024 benchmark.
### Interpretation
The bar chart provides a comparative analysis of the performance of four language models on different benchmarks. The AM-Distill-Qwen-72B model consistently outperforms the other models, especially on the MATH-500 benchmark. The LiveCodeBench benchmark appears to be the most difficult for all models. The data suggests that the choice of model can significantly impact performance, and the difficulty of the benchmark also plays a crucial role. The "Pass@1" likely refers to the evaluation metric, indicating the accuracy of generating the correct answer on the first attempt.