\n
## Bar Chart: Model Performance on Benchmarks
### Overview
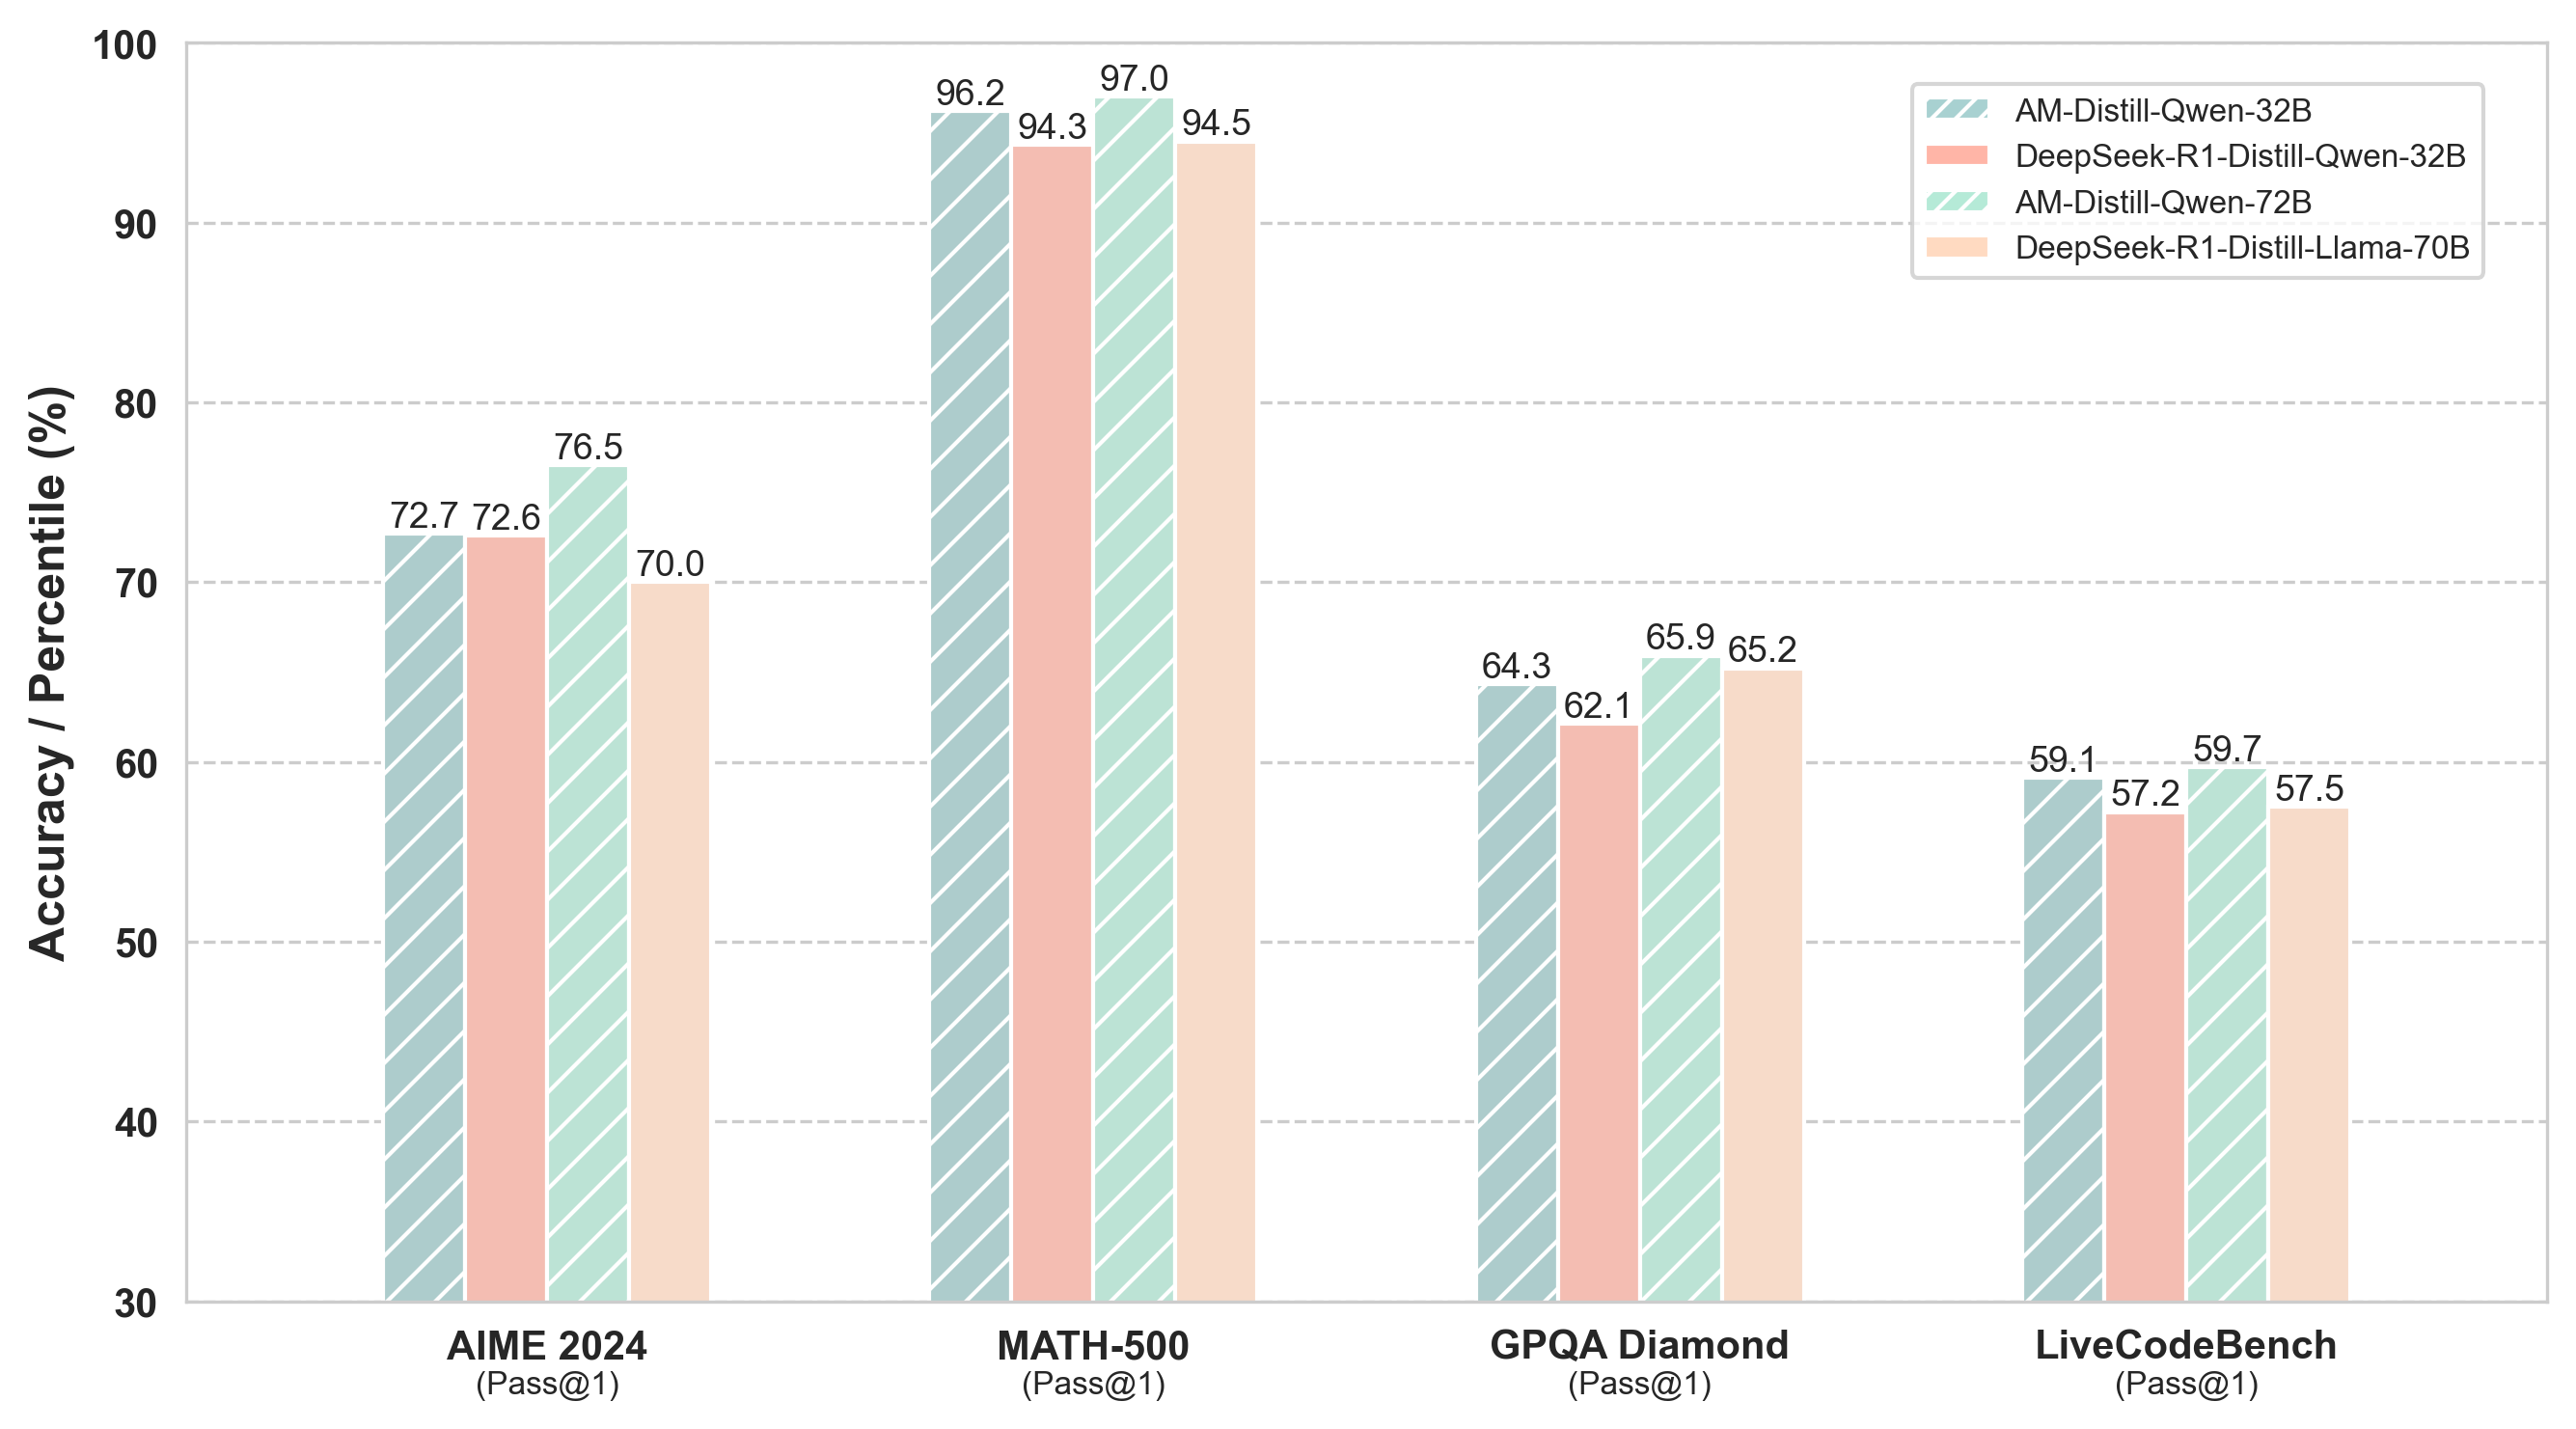
This bar chart compares the performance of four different language models – AM-Distill-Qwen-32B, DeepSeek-R1-Distill-Qwen-32B, AM-Distill-Qwen-72B, and DeepSeek-R1-Distill-Llama-70B – across four benchmarks: AIME 2024, MATH-500, GPQA Diamond, and LiveCodeBench. The performance metric is Accuracy/Percentile (Pass@1).
### Components/Axes
* **X-axis:** Benchmark Name (AIME 2024, MATH-500, GPQA Diamond, LiveCodeBench) with the Pass@1 metric specified below each name.
* **Y-axis:** Accuracy / Percentile (%) ranging from 30 to 100, with increments of 10.
* **Legend:** Located in the top-right corner, identifying the four models using both name and parameter size (e.g., AM-Distill-Qwen-32B). The legend uses color-coding to match the bars in the chart:
* AM-Distill-Qwen-32B: Light Red/Pink (hashed pattern)
* DeepSeek-R1-Distill-Qwen-32B: Medium Red/Pink (hashed pattern)
* AM-Distill-Qwen-72B: Light Green (hashed pattern)
* DeepSeek-R1-Distill-Llama-70B: Medium Green (hashed pattern)
### Detailed Analysis
The chart consists of four groups of bars, one for each benchmark. Within each group, there are four bars representing the performance of each model.
**AIME 2024 (Pass@1):**
* AM-Distill-Qwen-32B: Approximately 72.7%
* DeepSeek-R1-Distill-Qwen-32B: Approximately 72.6%
* AM-Distill-Qwen-72B: Approximately 76.5%
* DeepSeek-R1-Distill-Llama-70B: Approximately 70.0%
**MATH-500 (Pass@1):**
* AM-Distill-Qwen-32B: Approximately 96.2%
* DeepSeek-R1-Distill-Qwen-32B: Approximately 94.3%
* AM-Distill-Qwen-72B: Approximately 97.0%
* DeepSeek-R1-Distill-Llama-70B: Approximately 94.5%
**GPQA Diamond (Pass@1):**
* AM-Distill-Qwen-32B: Approximately 64.3%
* DeepSeek-R1-Distill-Qwen-32B: Approximately 62.1%
* AM-Distill-Qwen-72B: Approximately 65.9%
* DeepSeek-R1-Distill-Llama-70B: Approximately 65.2%
**LiveCodeBench (Pass@1):**
* AM-Distill-Qwen-32B: Approximately 59.1%
* DeepSeek-R1-Distill-Qwen-32B: Approximately 57.2%
* AM-Distill-Qwen-72B: Approximately 59.7%
* DeepSeek-R1-Distill-Llama-70B: Approximately 57.5%
### Key Observations
* **MATH-500 consistently shows the highest accuracy** across all models, with values generally above 94%.
* **LiveCodeBench consistently shows the lowest accuracy** across all models, with values generally below 60%.
* **AM-Distill-Qwen-72B generally outperforms AM-Distill-Qwen-32B** across all benchmarks.
* **DeepSeek-R1-Distill-Llama-70B generally performs similarly to DeepSeek-R1-Distill-Qwen-32B**, with slight variations depending on the benchmark.
* The differences between the models are more pronounced on some benchmarks (e.g., AIME 2024) than others (e.g., MATH-500).
### Interpretation
The chart demonstrates the performance of different language models on a variety of benchmarks designed to test different capabilities. The consistent high performance on MATH-500 suggests these models are strong at mathematical reasoning. The lower performance on LiveCodeBench indicates a relative weakness in code generation or understanding. The fact that the 72B parameter model (AM-Distill-Qwen-72B) consistently outperforms the 32B parameter model suggests that increasing model size generally leads to improved performance, although the gains are not always substantial. The comparison between the Qwen and Llama based models provides insight into the architectural differences and their impact on performance across different tasks. The Pass@1 metric indicates the percentage of times the model provides the correct answer as the *first* prediction, which is a stringent measure of performance. The use of a hashed pattern within the bars suggests a visual emphasis on the discrete nature of the data, rather than a continuous trend.