## Line Graph: Exponential Functions Comparison
### Overview
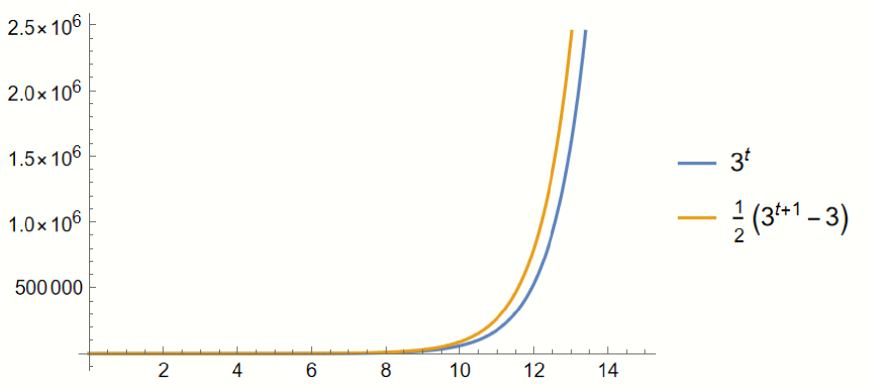
The image is a line graph comparing two exponential functions: $ 3^t $ (blue line) and $ \frac{1}{2}(3^{t+1} - 3) $ (orange line). The x-axis represents the variable $ t $, ranging from 0 to 14, while the y-axis represents the function values, scaled up to $ 2.5 \times 10^6 $. The graph highlights the growth patterns of both functions, with the orange line consistently outpacing the blue line after $ t = 1 $.
### Components/Axes
- **X-axis (t)**: Labeled as $ t $, with tick marks at intervals of 2 (0, 2, 4, ..., 14).
- **Y-axis (Value)**: Labeled as "Value" (no explicit unit), with tick marks at $ 5 \times 10^5 $, $ 1 \times 10^6 $, $ 1.5 \times 10^6 $, $ 2 \times 10^6 $, and $ 2.5 \times 10^6 $.
- **Legend**: Located on the right side of the graph.
- **Blue line**: Labeled $ 3^t $.
- **Orange line**: Labeled $ \frac{1}{2}(3^{t+1} - 3) $.
### Detailed Analysis
- **Blue Line ($ 3^t $)**:
- Starts at $ 1 $ when $ t = 0 $.
- Grows exponentially, with values doubling approximately every $ t \approx 1.58 $ (since $ 3^t $ doubles every $ \log_3(2) \approx 0.63 $, but the graph shows a slower visual doubling due to scaling).
- At $ t = 10 $, $ 3^{10} = 59,049 $, which is near the lower end of the y-axis.
- At $ t = 14 $, $ 3^{14} = 4,782,969 $, exceeding the y-axis maximum of $ 2.5 \times 10^6 $.
- **Orange Line ($ \frac{1}{2}(3^{t+1} - 3) $)**:
- Simplifies to $ \frac{3^{t+1} - 3}{2} = \frac{3 \cdot 3^t - 3}{2} = \frac{3}{2}(3^t - 1) $.
- Starts at $ 0 $ when $ t = 0 $ (since $ \frac{3^{1} - 3}{2} = 0 $).
- At $ t = 1 $, both lines intersect at $ 3 $.
- For $ t > 1 $, the orange line grows faster than the blue line. For example:
- At $ t = 2 $: Blue = $ 9 $, Orange = $ \frac{27 - 3}{2} = 12 $.
- At $ t = 10 $: Blue = $ 59,049 $, Orange = $ \frac{3^{11} - 3}{2} = \frac{177,147 - 3}{2} = 88,572 $.
- At $ t = 14 $: Orange = $ \frac{3^{15} - 3}{2} = \frac{14,348,907 - 3}{2} \approx 7,174,452 $, far exceeding the y-axis range.
### Key Observations
1. **Intersection at $ t = 1 $**: Both functions equal $ 3 $ at this point.
2. **Growth Rate Difference**: The orange line grows 1.5 times faster than the blue line for $ t > 1 $, as $ \frac{3}{2}(3^t - 1) $ scales the blue line by 1.5 and subtracts a constant.
3. **Y-axis Limitation**: The graph truncates values beyond $ 2.5 \times 10^6 $, obscuring the full extent of the orange line’s growth.
### Interpretation
The graph demonstrates how exponential functions with different scaling factors behave. The orange line, $ \frac{1}{2}(3^{t+1} - 3) $, is a transformed version of $ 3^t $, scaled by 1.5 and shifted downward by 1.5. This transformation ensures the orange line starts at 0 (vs. 1 for the blue line) and grows faster after $ t = 1 $. The intersection at $ t = 1 $ suggests a critical point where the two models yield equal results, potentially significant in contexts like population growth, financial models, or algorithmic complexity. The y-axis truncation highlights the rapid divergence between the two functions, emphasizing the importance of scaling in exponential growth scenarios.